The Definitive Guide to API Test Automation With Playwright: Part 3 - Debugging API Tests

A big part of writing automated checks is testing and debugging the code you write, ideally ensuring there aren't any bugs in test code. For part 3 I will be covering how I run my tests, debug my tests, and how I get feedback before the code is merged into the code branch. If you missed the Introduction, Part 1, or Part 2, I encourage you to check those out to get the context of where we are jumping in.
What I'll cover
- How I use VS Code to debug my tests
- Using UI mode to debug
- Using Playwright Test Trace Files via Show-Report
- Using console.log()/console.table()
- How I get feedback via GitHub Action before merging code
VS Code to Debug Tests
When I am writing or debugging Playwright tests I typically use the Playwright Test for VS Code extension. Once installed, you can select the Testing (beaker icon) and view, debug, or run the tests that are written. What's nice about this, is you can run individual tests with a button click.
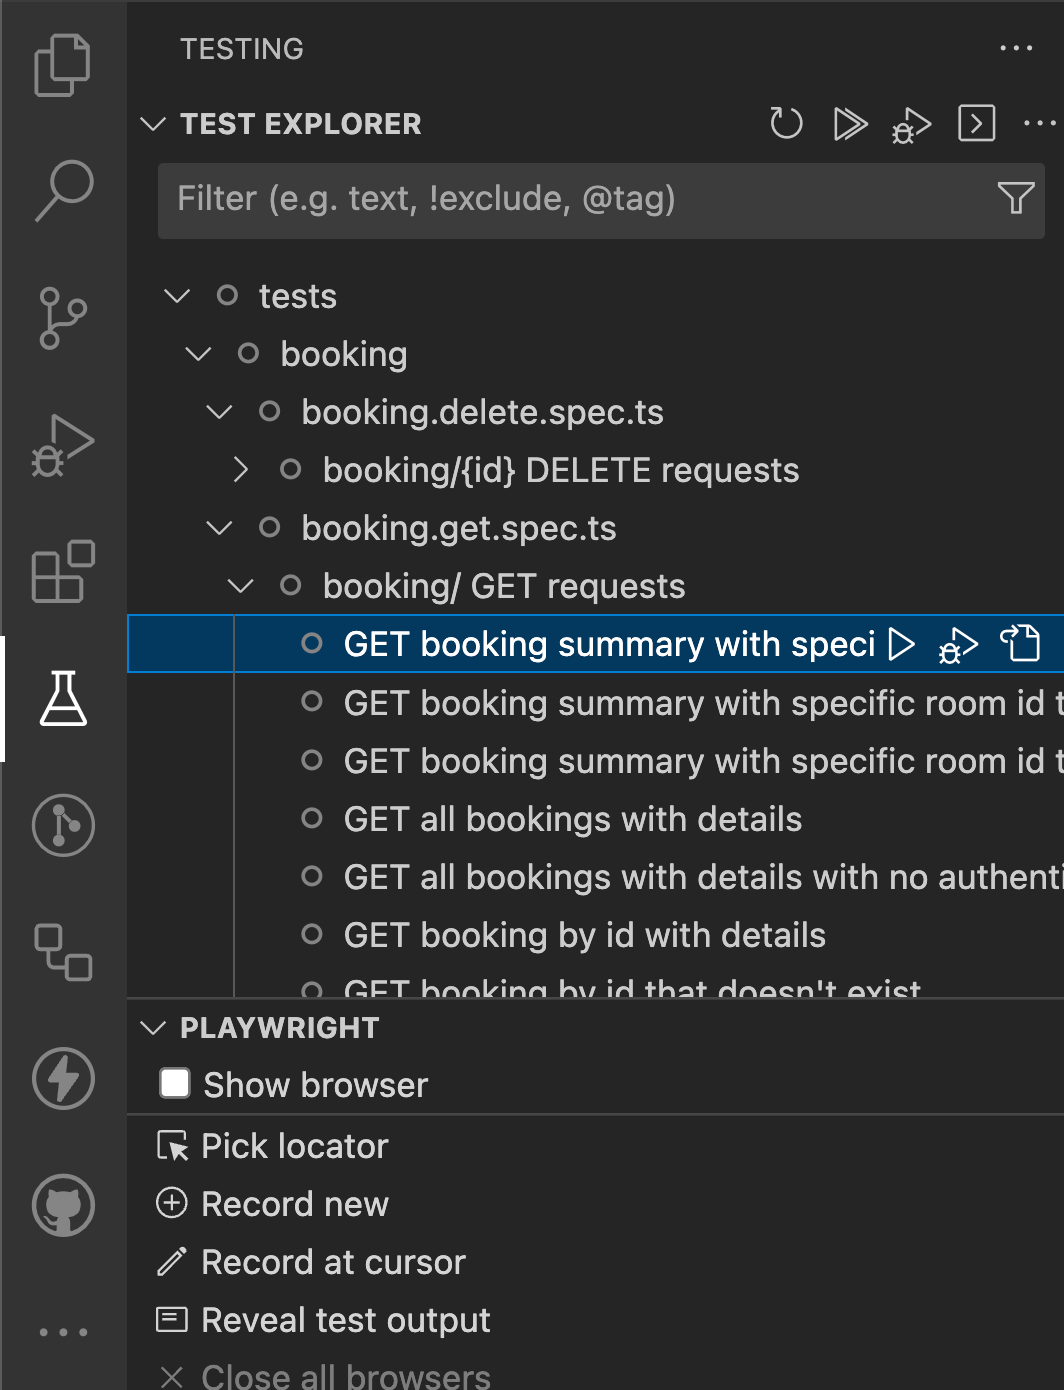
With the extension installed you also will see green play buttons on each of your test and describe blocks where you can run the checks from the spec.ts file directly.
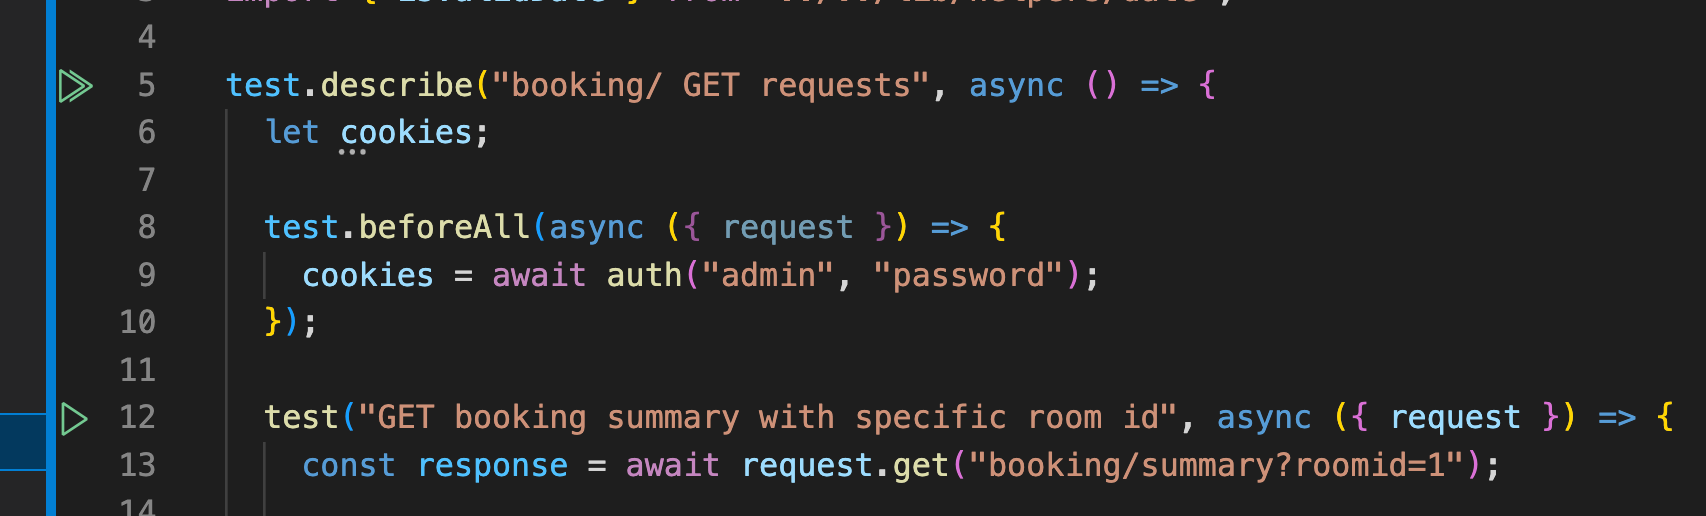
I'll demonstrate using running a test in debug mode below. Before I run the test, I will add a breakpoint where I want the test to pause and open the debugger menu. From here I am able to see information about the tests that I typically wouldn't see. This is helpful in trying to determine what information variables are assigned to. In my example I will add a debug point after I assign the body variable to response.json().
From the above example, you can see I was able to validate the shape of the data that is returned { bookings: [ { bookingDates: { checkin: "Date", checkout: "Date"} } ] }, along with any specific data.
Using Playwright UI mode
To use UI mode you will need to have Playwright version 1.32 in your project. To upgrade your version it's as easy as visiting your package.json folder, finding the devDependencies > @playwright/test, and updating the value to 1.32 or higher.
If you are not sure what the latest version is you can find it on GitHub Releases page. You can also follow this guide to set up slack notification when a new version of Playwright is released.
On to Playwright UI mode, you may be thinking, why do I need to use UI mode, when we are running API tests? Well you don't have to but it's a great way to run and debug tests and view the network requests as they are occurring versus adding console.log or using the VSCode debugger.
To run Playwright in UI mode add -- ui to the end of your playwright cli command. To make this easier I went ahead and added a npm scripts entry to the package.json file. If you are following along I create a key named ui and add the command npx playwright test --ui what this allows me to do is run npm run ui and the command npx playwright test --ui will get executed from the command line. I find creating certain npm scripts really useful in taking long cli commands and reducing them to something you can quickly type.
{
  "name": "playwright-api-test-demo",
  "version": "1.0.0",
  "description": "This repository will serve as a place where I add API test Automation checks for articles written at <https://playwrightsolutions.com>",
  "main": "index.js",
  "scripts": {
    "ui": "npx playwright test --ui"
  },
  ...
Once npm run ui is run, you will notice a new window that pops up, after a few seconds all the tests in your suite should also show up on the left hand column. This is where we will run or debug our tests.
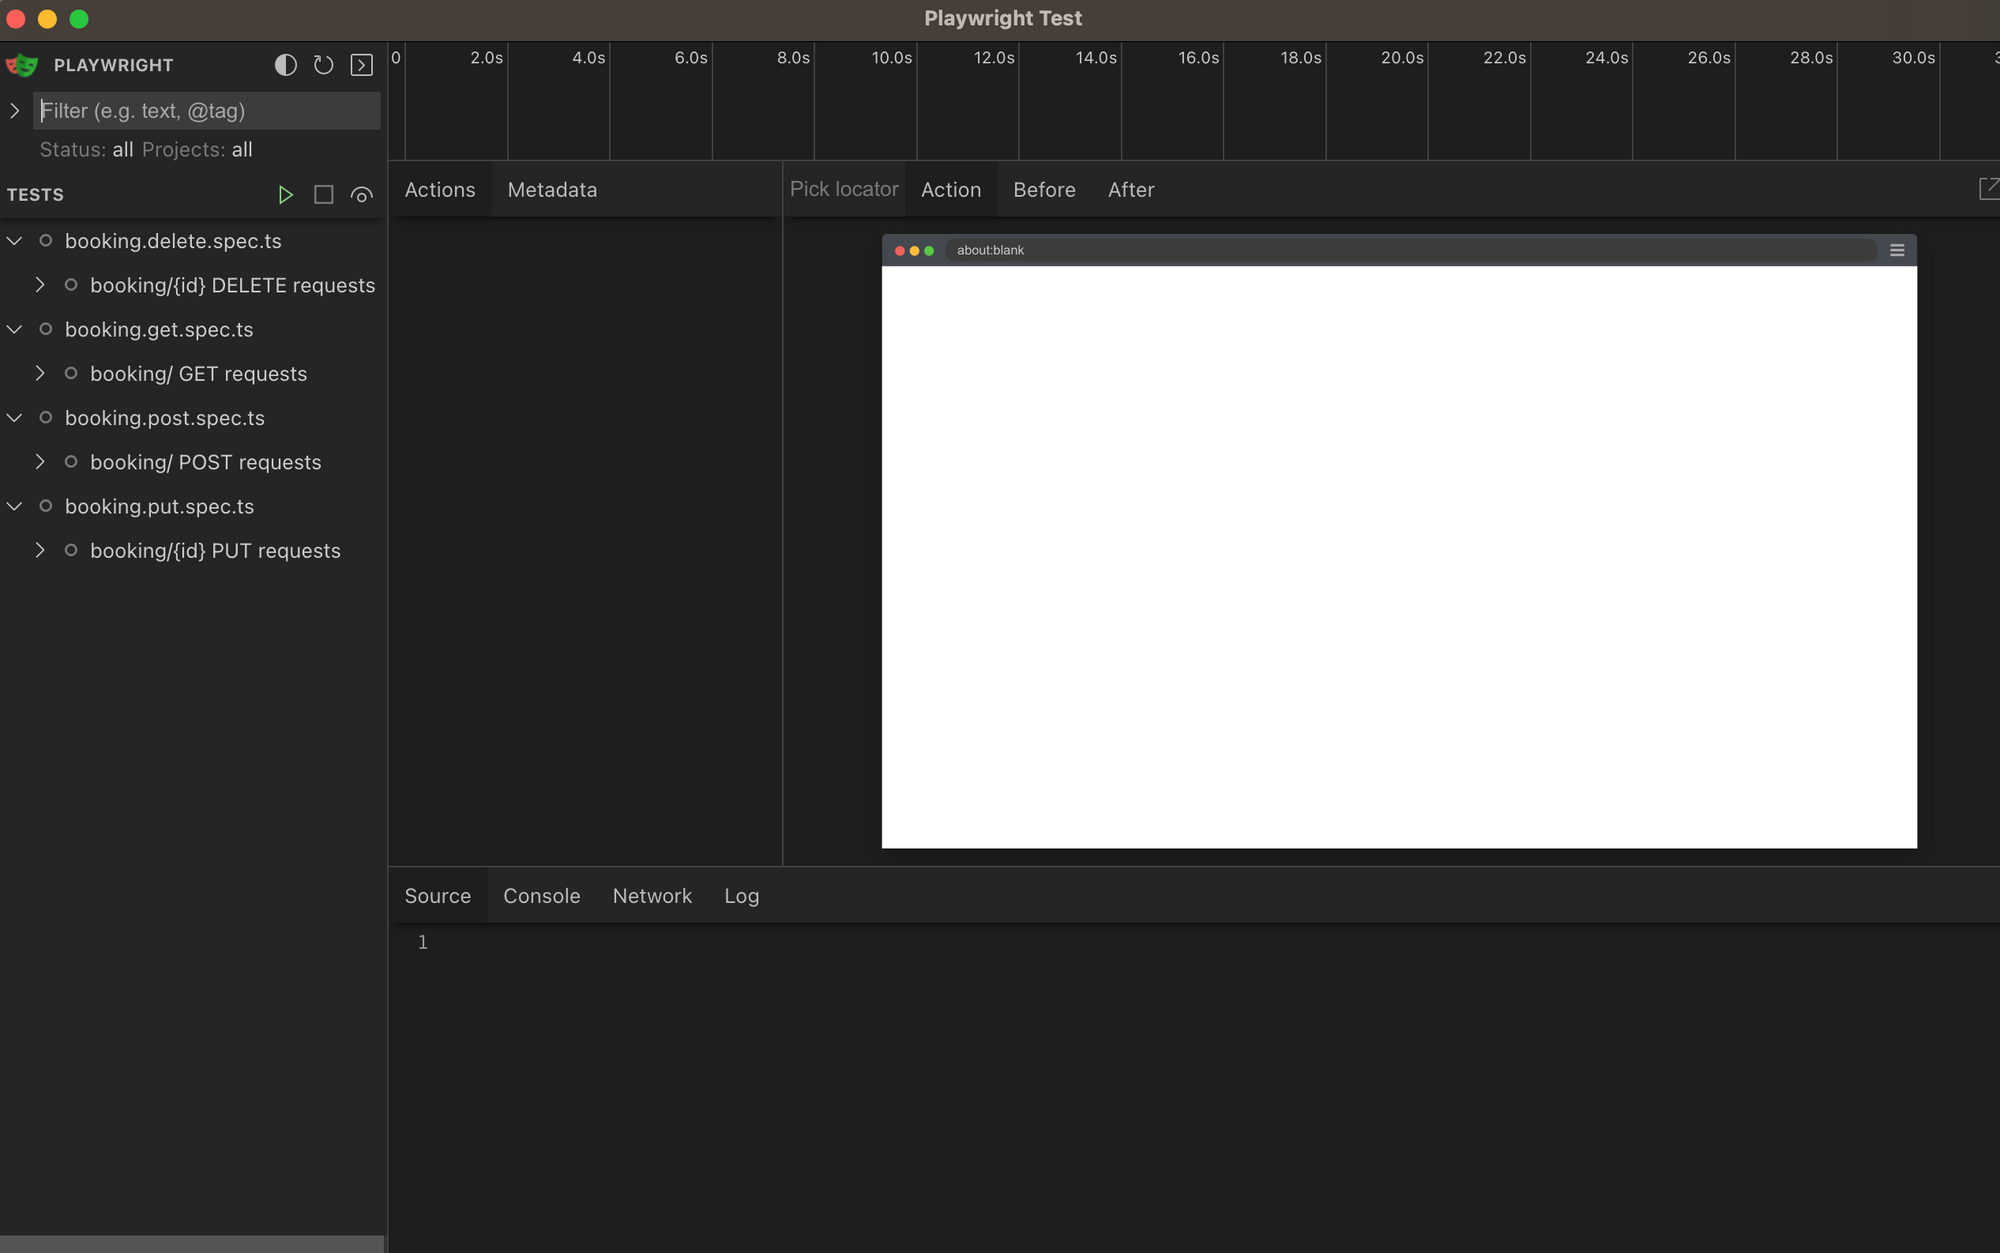
To run a test in ui mode select either a file, a group of tests test.describe() or an individual test test(). You can run the test or group of tests using the green play button. Once run you will be able to see the history of each test in the Actions panel, see the test code under source, console logs under console, http network requests under network, and test logs under logs. For debugging API, typically you will want to find specific network requests that were made and look at the different request and response + headers and body. All of that is viewable on each http request that is made from the Playwright Test you run. An example can be found below.
Though we aren't utilizing all the features with UI (as we aren't opening a browser), there is a ton of value in being able to run tests with all the details of the http network requests at our fingertips. Before the ui feature existed I found myself running the tests with traces always on, in order to view the test report to view the http requests via the trace file viewer.
Using Playwright Test Trace Files via Show-Report
This was my go to way to debug tests prior to the ui mode being released. This method requires you to update your playwright.config.ts to set the trace: "on". This will make it where the trace files are recorded for each test, and will be available when viewing the Playwright Test Report. An example can be found below, this can also be set when running from the command line overwriting whatever is in the playwright.confg.ts file by running npx playwright test --trace on docs for command line.
//playwright.config.ts

export default defineConfig({
  use: {
    baseURL: process.env.URL,
    ignoreHTTPSErrors: true,
    trace: "on",
  },
  retries: 0,
  reporter: [["list"], ["html"]],
});
Once the tests run and are complete, it's as simple as running npx playwright show-report which will bring up the Playwright Test Report, and because we set trace to "on" we will have all network requests in the report! Below is an example of the Test Report in action.
Console.log / Console.table
The below example I am running the command npx playwright test tests/booking/booking.get.spec.ts:48 and adding the console.log() commands
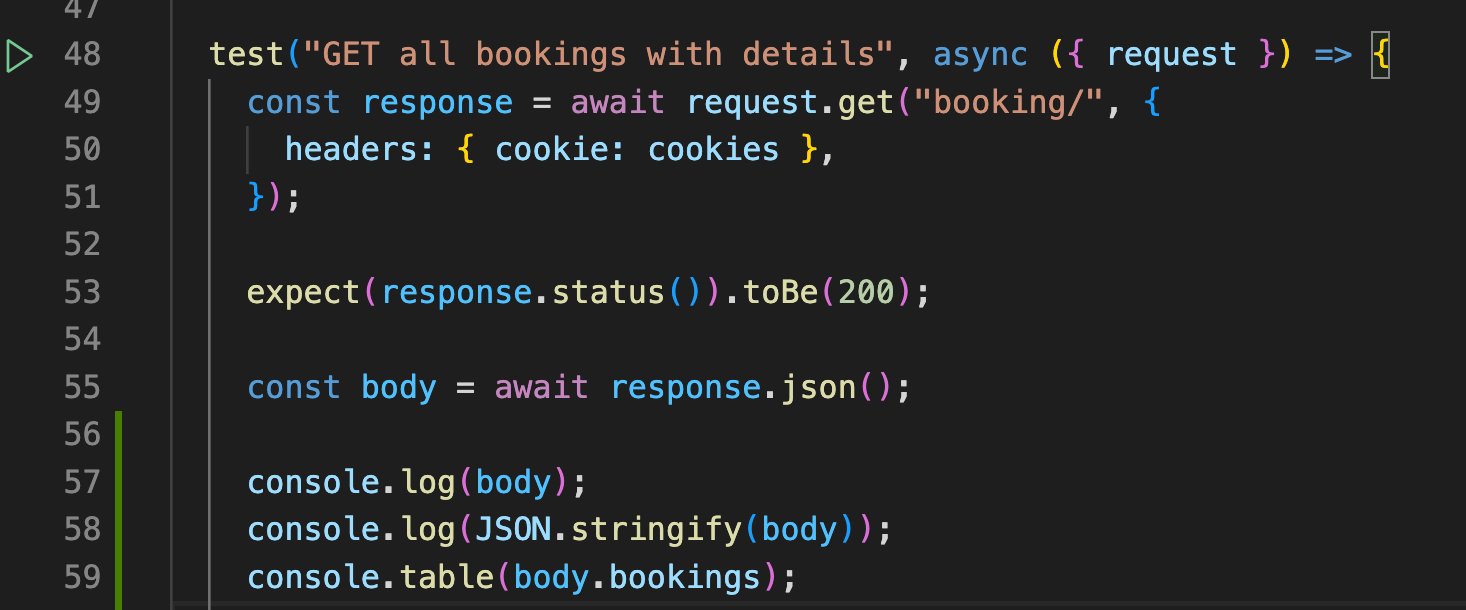
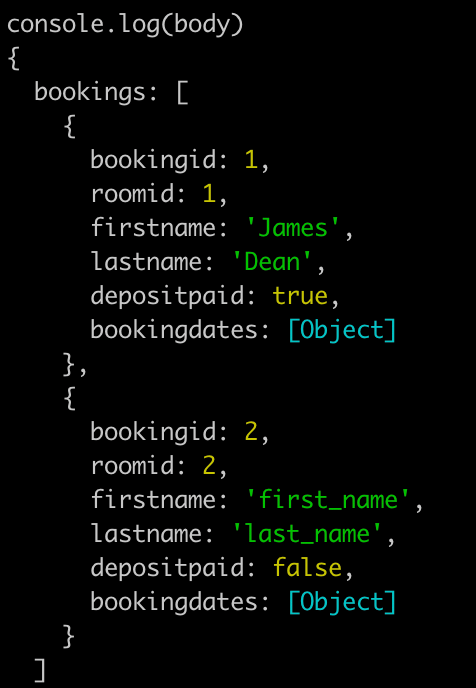
Another common method to debug your code is to add console.log statements within the codebase. Depending on the shape of your data, you could run into mixed results just using the console.log(body), if there are additional objects like the bookingdates listed below, you will notice they are displayed as [Object] in the console.log output.
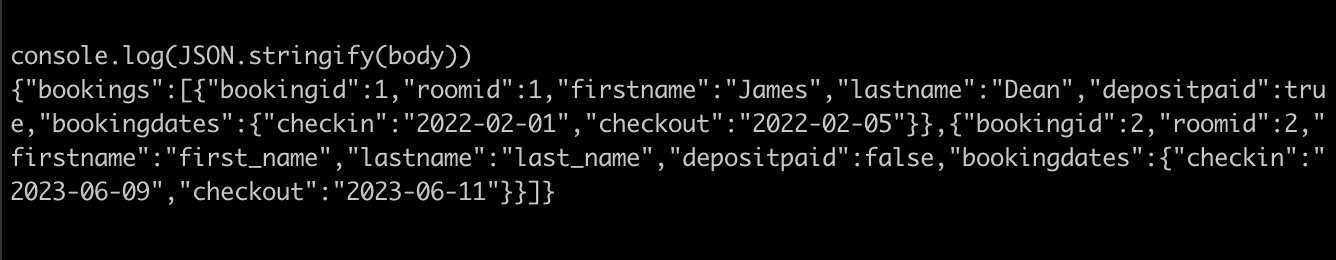
When you want to see all the data, you can use the JSON.stringify() method to transform the json to a string. This is helpful if you want to see all the data, but isn't very useful within your tests, as you no longer have a javascript object that you can use the dot notation to get info from.
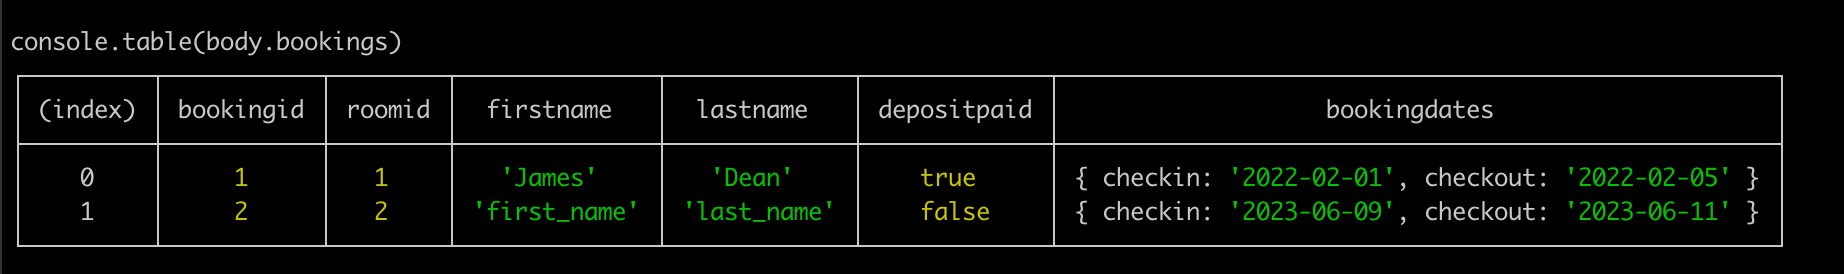
Another useful tip that Joel Black taught me about is console.table(), you can pass an array of objects and get really nice formatting out of it. Note, I am passing in body.bookings. Viewing data this way can make it easier to see differences in what is returned for easy comparisons.
Running only changed tests on a pull request
I recently covered how I do this in a recent post. It made enough sense for me to be a stand alone post. Implanting this can allow you to get quick feedback from your tests running in CI. What's really nice is if you enable capturing the trace files on failures and using the article below, you will have access to the test artifacts after the test run.
As you can see there are quite a few different ways to debug your tests as you are writing and maintaining them. I'm sure there are more, if you have any please reach and and share them with me on LinkedIn!
Thanks for reading! If you found this helpful, reach out and let me know on LinkedIn or consider buying me a cup of coffee. If you want more content delivered to you in your inbox subscribe below.