In-Depth Review of Playwright Dashboard by Currents

In this guide I'll be sharing my experiences using the Playwright Dashboard by Currents with my Playwright Solutions projects I've built over the years. This article is sponsored but I was given the liberty of sharing my honest experiences with the platform. All of my examples will be using Playwright, though Currents does support certain versions of Cypress.

TL;DR
Currents is the Playwright Reporting Dashboard I had no idea I needed.
Outline
- Currents Playwright Dashboard Is
- Currents Playwright Dashboard Is Most Useful For
- Integrating My Playwright Projects
- Exploring the Playwright Dashboard
- Things I Did Not Cover
- Things I Like About Currents Dashboard
- Things I Don't Like About Currents Dashboard
Currents Playwright Dashboard Is
A cloud reporting service for Playwright Test runs. The service collects all the details of every step of Playwright tests, and provides tools to debug, troubleshoot, and analyze the results.
Currents Playwright Dashboard Brings The Most Value
- To Leaders, Managers, Developers, or Testers that are managing test automation for multiple projects/products.
- To teams that value and report on historical data from Test Automation runs. This typically comes with medium to large size businesses where Leadership wants to track metrics and health of test automation projects.
- To teams that want to target reducing automation run times.
- To teams that want to deal with their flaky test problem efficiently.
- To teams with a growing test suite that requires the efforts of more than 1 person to maintain.
My Context
My experiences in test automation span over 10 years. Over that time I've experienced a lot problems, many of which are faced by small to medium sized development teams. This could include anywhere from 3-20 developers and testers working on a software product at a time. At one of these companies we grew through software product acquisitions, where new software projects written in different languages that had different level of test automation came under my influence as Director of Software Test. This presented unique challenges that smaller teams may not face.
My First Impressions
I first heard about Currents through Sorry Cypress a self hosted open source project that would unlock Cypress functionality such as parallelization and reporting. I didn't really pay too much attention to this as my main focus over the past 2 years has been building our my test automation in Playwright. The next time they really popped on my radar was when Cypress published this blog post, which lead me to research who they blocked and why. After revising currents.dev and see they now supported Playwright, I chose to explore the functionality of what their tool offers for Playwright users via their website.
Shortly after I also connected with Andrew Goldis over twitter and eventually a face to face video call, which lead to a great conversation about his approach to running his business, the needs he is working to solve for Playwright Reporting, and work life blend.
I walked away from that conversation and went ahead and signed up for a 14-day free trial to get some hands on experience with the tools and functionality that currents.dev dashboard offers.
Integrating My Playwright Projects
First off it was really really easy to get my projects integrated. There are 2 ways you can integrate your projects, using the Currents Playwright reporter or using the CLI which is a custom command line tool the Currents team has built.
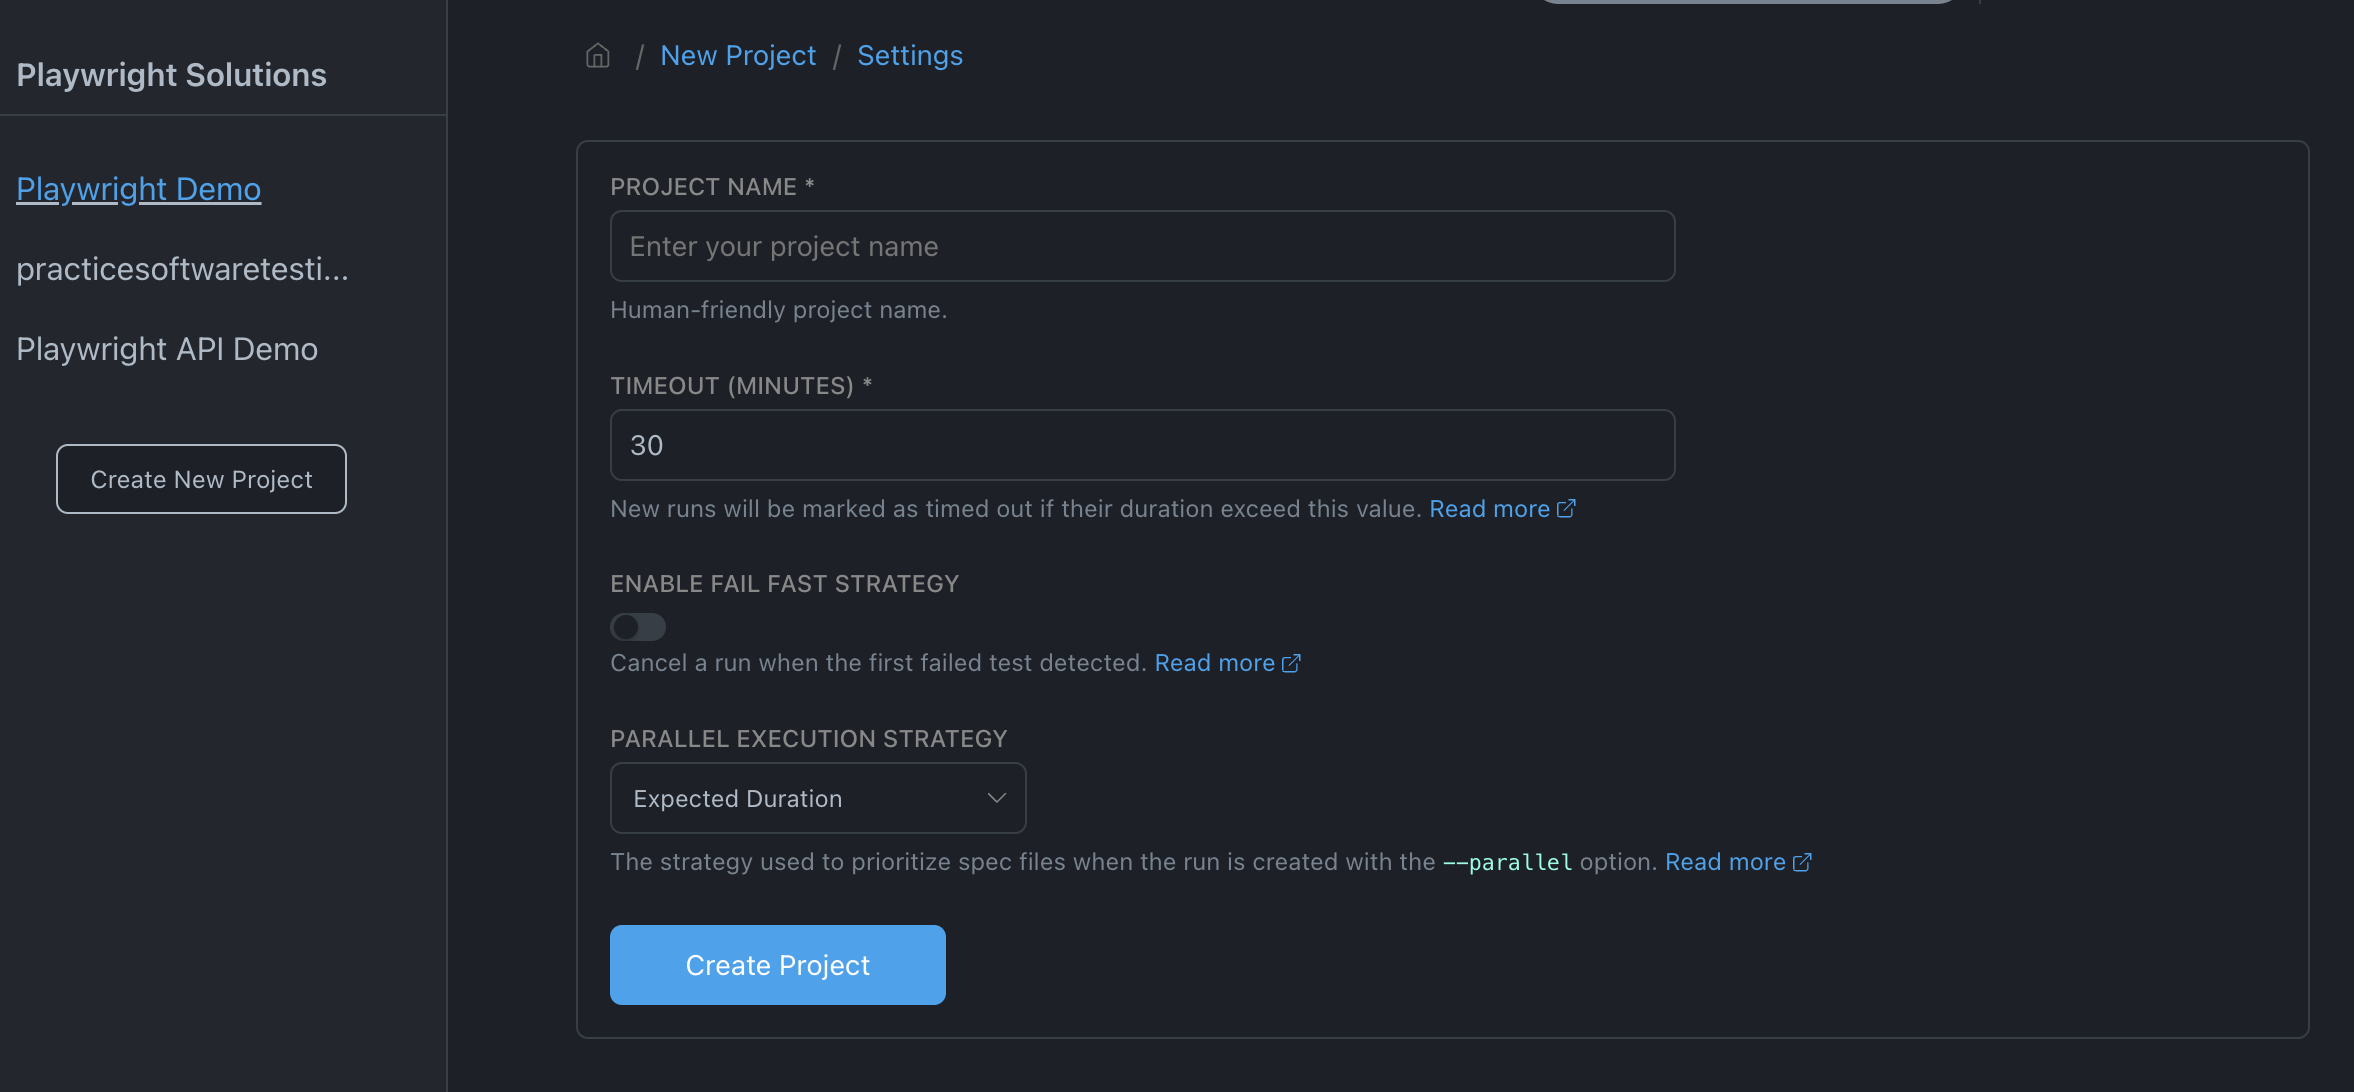
Creating a Currents Project
Before you have something to integrate into your test automation suite you have to create a Currents project. This is a way to organize your different automation suites. Each project will have a unique Project ID and Key. These are necessary to proceed.
Integrating Using Currents Playwright Reporter (Option 1)
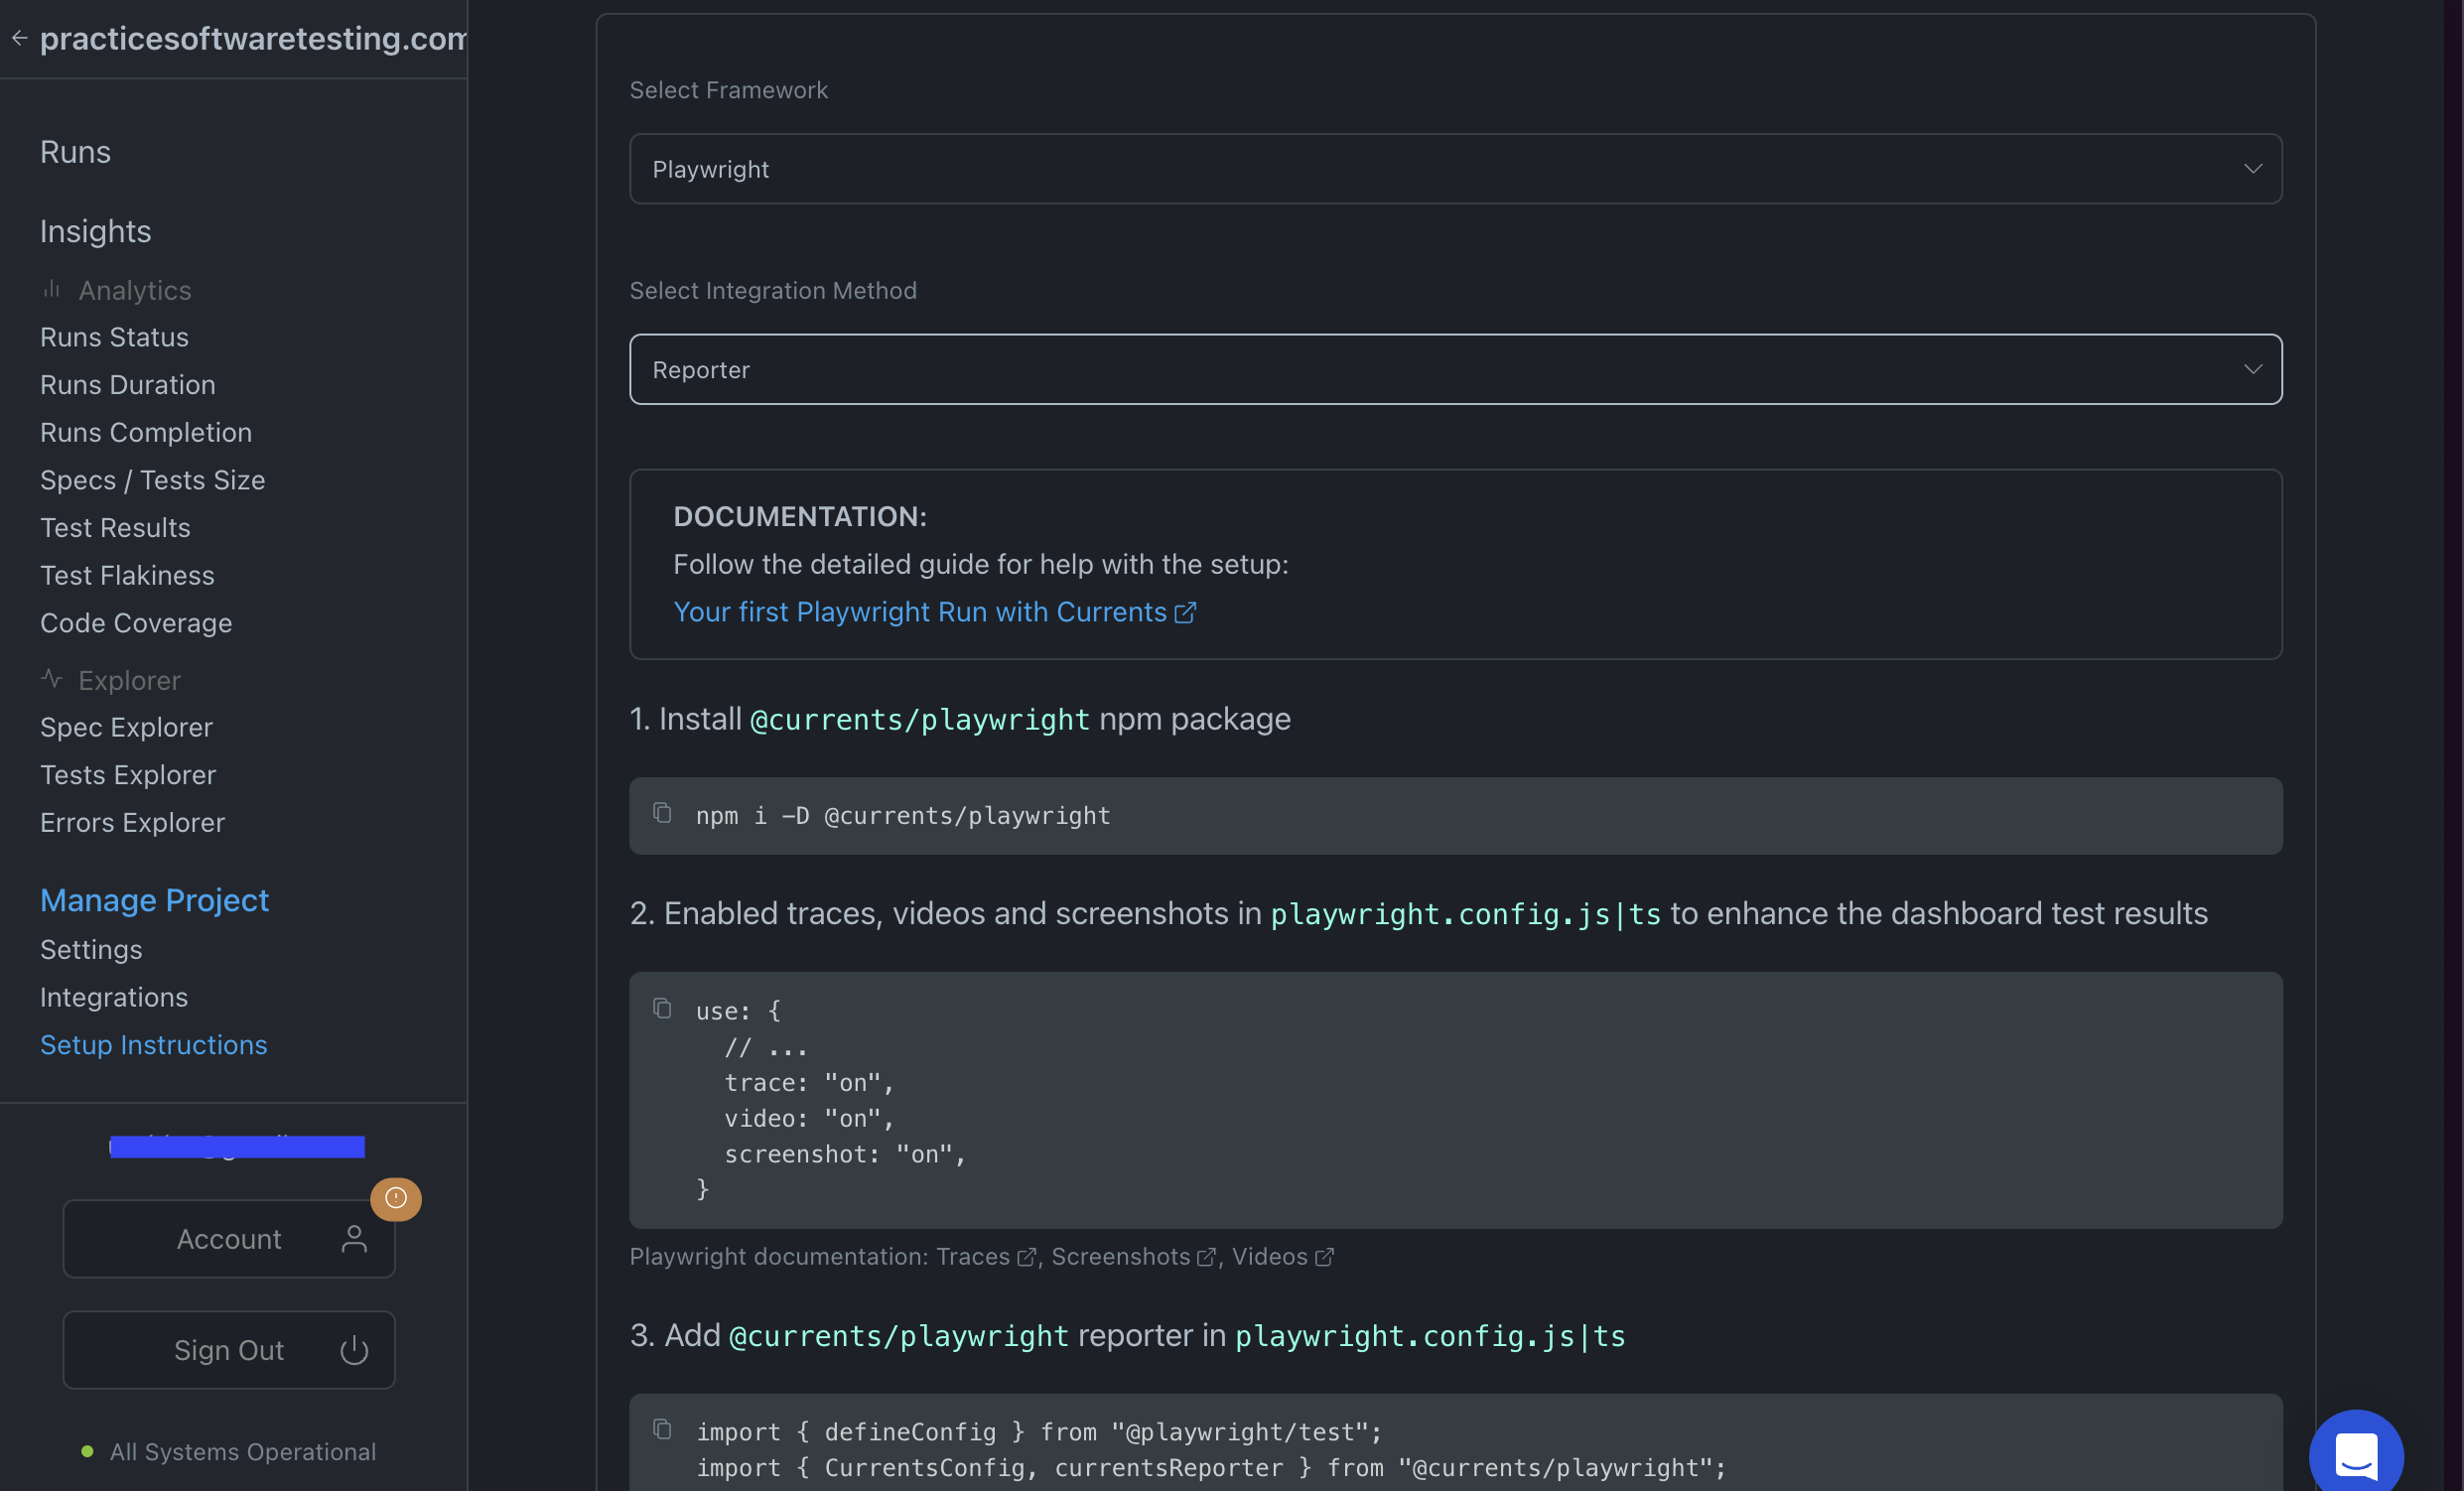
We'll start off by utilizing the Currents playwright reporter through the playwright.config.ts file. This is the approach I initially took with my repositories. I'll be showing off examples from https://github.com/playwrightsolutions/playwright-practicesoftwaretesting.com in this section. While logged into the Currents app, with a project opened in the section "Manage Project", you will have a section labeled "Setup Instructions". From here you can select Reporter or CLI and get code snippets to make the integration seamless.
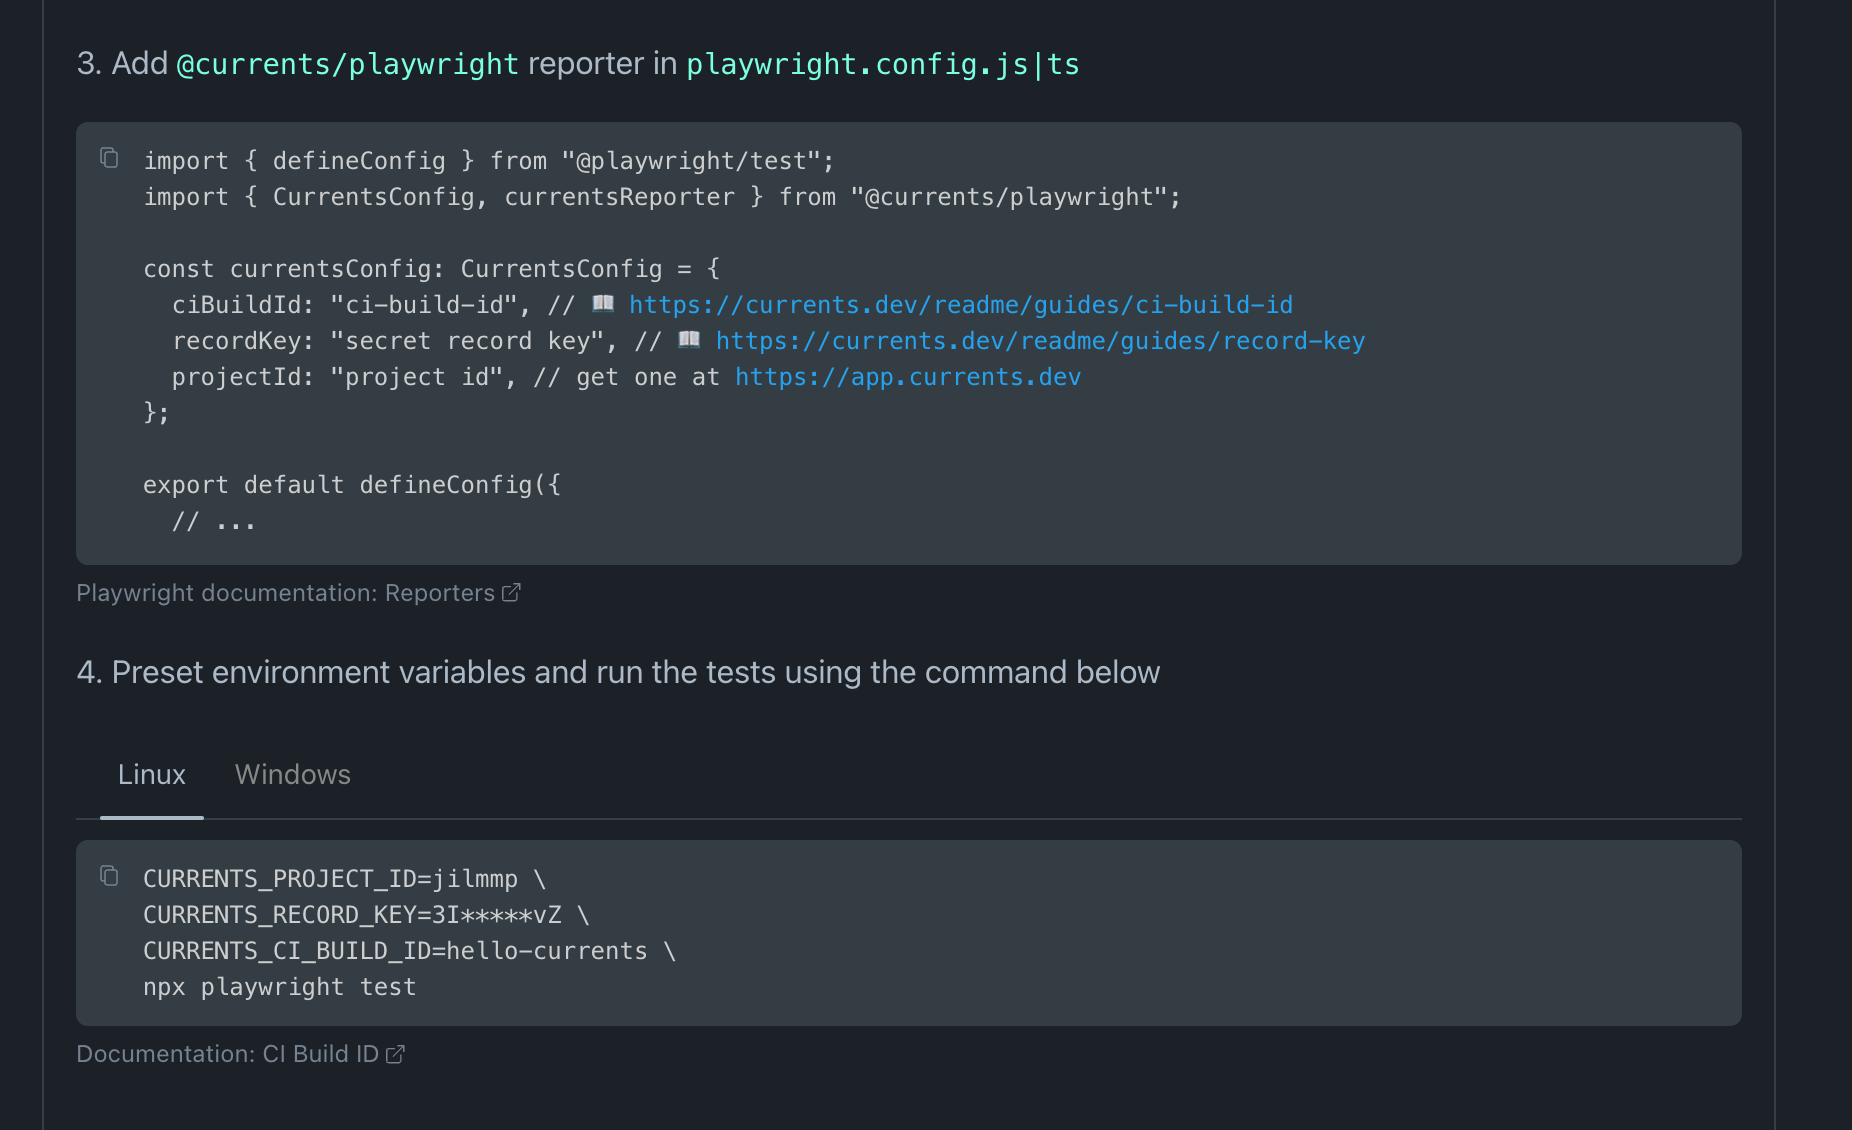
My specific implementation is in full below. A few things to note, is while I was testing this functionality out, I created environment variables in my .env file for the project id and the currents record key (think of that as your secret API key). This allowed me to not have to add these keys to my config and will let me add them to github secrets later when I implement the CI portion.
// .env

CURRENTS_PROJECT_ID=jilmmp
CURRENTS_RECORD_KEY=3ILxxxxxxxxxvZ
And I added this line of code in my `playwright.config.ts` which would basically always create a unique Build Id when I was am testing things locally.
if (!process.env.CURRENTS_CI_BUILD_ID) {
  process.env.CURRENTS_CI_BUILD_ID = "butch-local-" + new Date().getTime();
}
If you don't have logic like this you will have to go and update the CURRENTS_CI_BUILD_ID environment variable anytime you want a separate run created in the Currents app. When we implement this in the CI pipeline, this is less of a concern as you have unique commit ids that can be used for this value as shown in the Currents CI examples.
// playwright.config.ts

import { defineConfig } from "@playwright/test";
import type { APIRequestOptions } from "./lib/fixtures/apiRequest";
import { TestOptions } from "./lib/pages";

require("dotenv").config();

if (!process.env.CURRENTS_CI_BUILD_ID) {
  process.env.CURRENTS_CI_BUILD_ID = "butch-local-" + new Date().getTime();
}

export default defineConfig<APIRequestOptions & TestOptions>({
  timeout: 30_000,
  projects: [
    { name: "setup", testMatch: /.*\.setup\.ts/, fullyParallel: true },
    {
      name: "calculation",
      testMatch: /.*\.calculation\.ts/,
    },

    {
      name: "ui-tests",
      dependencies: ["setup", "calculation"],
    },
  ],
  testDir: "./tests",
  fullyParallel: true,
  forbidOnly: !!process.env.CI,
  retries: process.env.CI ? 2 : 2,
  workers: process.env.CI ? 1 : undefined,
  reporter: process.env.CI
    ? [["list"], ["html"], ["@currents/playwright"]]
    : [["html"], ["list"], ["@currents/playwright"]],
  use: {
    testIdAttribute: "data-test",
    baseURL: process.env.UI_URL,
    apiURL: process.env.API_URL,
    apiBaseURL: process.env.API_URL,
    trace: "on",
    screenshot: "on",
    video: "on",
  },
});
With this config and the saved environment variables anytime I run my tests the results will be sent to the Currents app. Once I managed to get things working, I went ahead and updated my reporter to only push results to the Currents app when running in the CI pipeline. This ensured that I wouldn't send results to the Currents Dashbaord when developing or debugging on my local machine. An example of my config reporter section is below.
// playwright.config.ts

  reporter: process.env.CI
    ? [["list"], ["html"], ["@currents/playwright"]]
    : [["html"], ["list"]],
Integrating Using Playwright Reporter GitHub Action
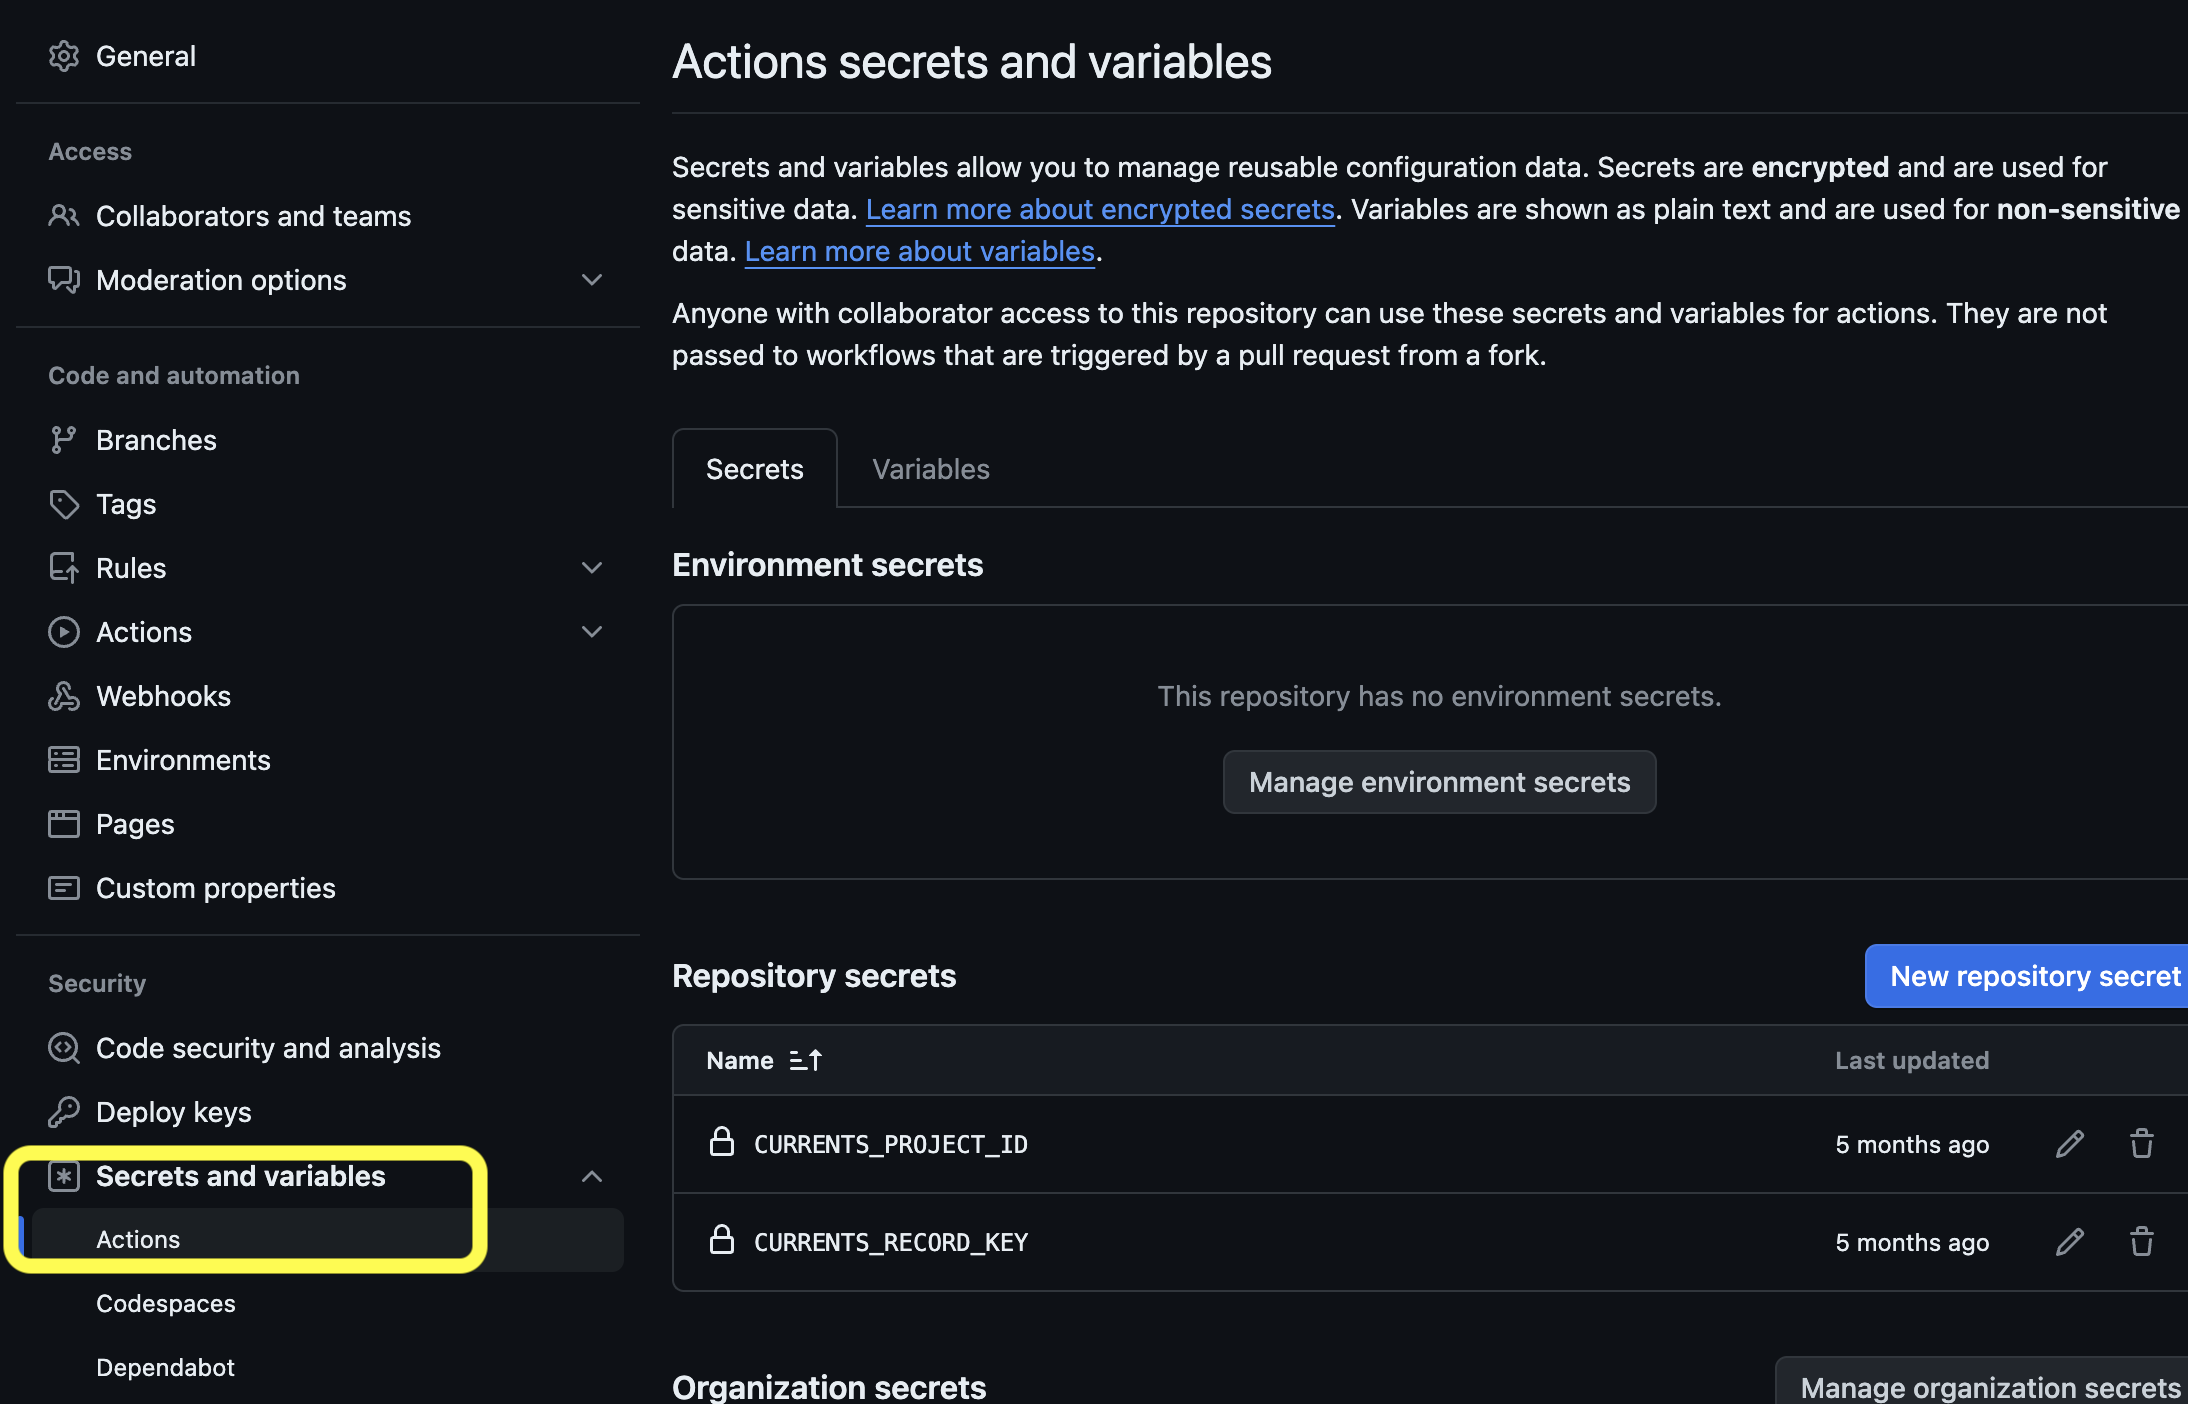
For my CI pipeline I use GitHub Actions. The Currents Playwright GitHub Action docs included a link to a GitHub actions demo repository with multiple examples included. Since I already had a GitHub actions file built I just decided to add on to my existing file. I already had sharding setup for this repository, all I had to do was add environment variables which I removed from my .env and moved to GitHub Action secrets.
        env:
          CURRENTS_PROJECT_ID: ${{ secrets.CURRENTS_PROJECT_ID }}
          CURRENTS_RECORD_KEY: ${{ secrets.CURRENTS_RECORD_KEY }}
          CURRENTS_CI_BUILD_ID: reporter-${{ github.repository }}-${{ github.run_id }}-${{ github.run_attempt }}
The secrets can be configured through GitHub repository settings. Any GitHub actions secrets setup this way are available as secret variables that can be used on GitHub action runs using the syntax in the above code block.
The full GitHub Action .yml file is below. One other thing to note is we are dynamically setting the CURRENTS_CI_BUILD_ID with information from the GitHub context.
// .github/workflow/playwright.yml

name: Playwright Tests
on:
  push:
    branches: [main, master]
  pull_request:
    branches: [main, master]
  schedule:
    - cron: "0 6 * * *"
  workflow_dispatch:

jobs:
  test:
    strategy:
      fail-fast: false
      matrix:
        # run 3 copies of the current job in parallel
        shard: [1, 2, 3]
    timeout-minutes: 60
    runs-on: ubuntu-latest
    steps:
      - uses: actions/checkout@v3
      - uses: actions/setup-node@v3
        with:
          node-version: 16
      - name: Install dependencies
        run: npm ci
      - name: Install Playwright Browsers
        run: npx playwright install --with-deps

      - name: Run Playwright tests
        env:
          CURRENTS_PROJECT_ID: ${{ secrets.CURRENTS_PROJECT_ID }}
          CURRENTS_RECORD_KEY: ${{ secrets.CURRENTS_RECORD_KEY }}
          CURRENTS_CI_BUILD_ID: reporter-${{ github.repository }}-${{ github.run_id }}-${{ github.run_attempt }}

        run: |
          echo "The github event is: ${{ github.event_name }}"
          npx playwright test --shard=${{ matrix.shard }}/${{ strategy.job-total }}

      - uses: actions/upload-artifact@v3
        if: always()
        with:
          name: playwright-report
          path: playwright-report/
          retention-days: 30
Integrating using Currents CLI (Option 2)
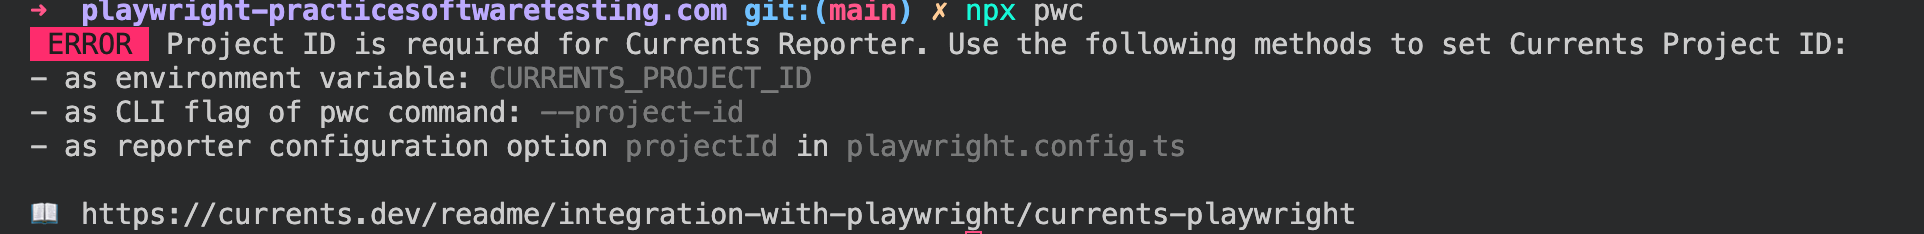
The second option for integrating Currents is using the CLI option, the details will be found in the same section as discussed before: "Manage Project" within a section labeled "Setup Instructions". Once you have CLI selected you see the 3 different things that are needed.
- Installing
@currents/playwright - Updating the
playwright.config.tsfile to always have trace, video, and screenshots. (this will make debugging within the Currents Dashboard much easier). - The Specific run command
npx pwc .....
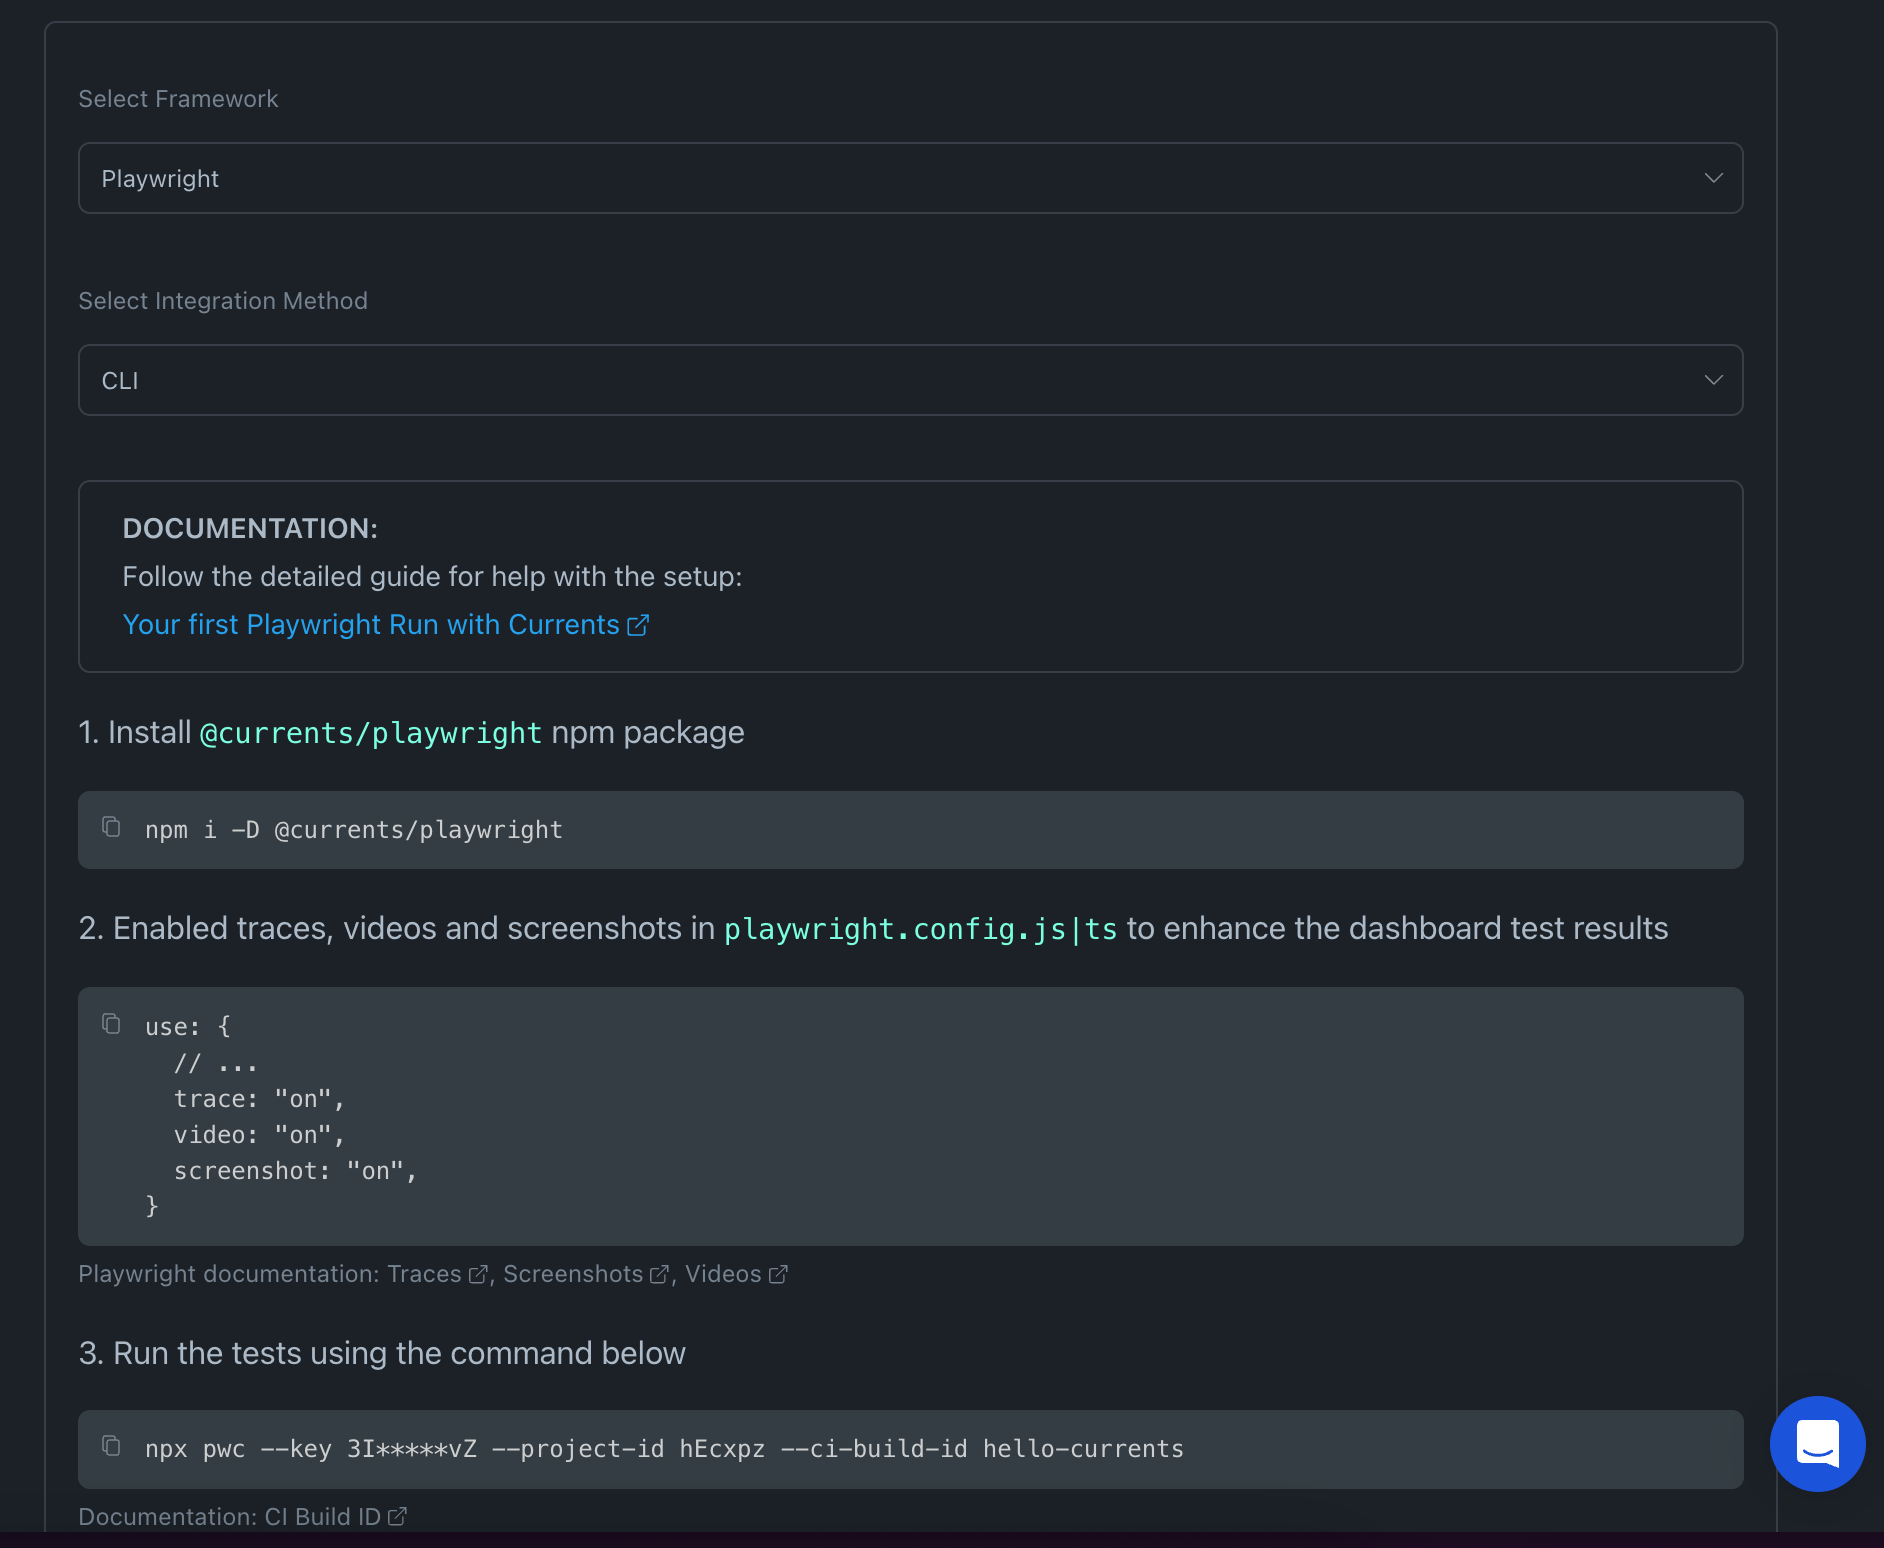
As you can see there are less steps to get started. What's nice about the CLI command which wasn't apparent to me until reading through the documentation, is that you don't have to pass in command line flags but you can use environment variables as well.
Another really nice feature of the CLI command is that you can pass in any command line flags that you would typically use for running your playwright tests and they will be applied to the playwright run. For example I can easily replace playwright with pwc to run the exact configuration with the benefits of sending our test run data to the Currents Dashboard.
npx pwc test --grep-invert=@unsatisfactory --retries=2 --workers=4
Orchestration using Currents CLI (Option 2)
TLDR; If you have over 100 tests or long tests and are looking to shorten your feedback loops, invest in utilizing Playwright Currents Orchestration.
During my experimentation with Currents Dashboard a set of new features were released with v1.0.0. These included:
- Orchestration
- Step Level Reporting
- Full Parallel Support
The full details can be found on this blog post along with impelmentation instruction.
Out of all of these features the Orchestration functionality really peaked my interest, as I've run into trying to balance tests across shards to increase the speed of my teams feedback loops.
The command to run the Playwright Currents CLI command in Orchestration mode example is below. I found I had to create a project in my playwright.config.ts file and then had to pass in the project into the command like so below. What's nice about this command as well is you can also pass in other playwright CLI commands in, so in the case below I am not running any tests tagged with @axe. This gives me a ton of flexibility when it comes to building out my CI pipeline.
npx pwc-p --project projectA --grep-invert @axe
In the testing of my demo repositories I didn't see any significant speed gains from using shards and multiple runners as most of my tests are less than 5 seconds to complete each and I only have around 20 tests total. What I did notice was if I wanted to take full advantage of the sophisticated orchestration I would need to refactor the way I have my tests written. Let's take a look at the limitations below.
Limitations:
- Playwright Project dependencies are not currently supported - i.e. if you have projects that depend one on another, orchestration will not consider the dependencies. As workaround you can run the projects in the desired order explicitly by defining separate CI steps with
--project <name>specification. - Global Setup and Teardown. An orchestrated execution will run a playwright command for each individual file of your testing suite. Beware, that the global setup or teardown routines will run for each spec file, accordingly.
- Rerunning a failed CI execution requires generating a new CI Build ID also a rerun will include all the tests - not only the failed ones.


The specific areas I would have to refactor for efficiency would be the Global Setup and Teardown steps. Currently for many of my projects I use the Global Setup to:
- Calculate Test Coverage/Feature map
- Create Authentication
- Create Test Data (Seeding the database via API calls)
- Create Authenticated Sessions
- Set Environment variables
- Do Data Cleanup (sometimes I do this before I run my tests)
Running a block of code trying to do a lot of the setup can take time sometimes 2-10 seconds depending on how many steps I have coded. With the limitation above The Global Setup would run every time any single spec ran which is very inefficient. This would require breaking up my test setup steps into projects and working through a way to pass data from one project to another. With the flexiblity with GitHub Actions this wouldn't be hard to do with artifacts.
I believe the more tests/longer runtime you have the more valuable this feature could be to you and your team, especially if you are looking to shorten the feedback loops to developers/testers.
One final advantage of utilizing orchestration is a feature which is currently in experimental mode which is: Redriving Tests. Because of the way the Currents team built out the orchestration functionality offloading the "test/spec" selection process from the local command line to the Currents servers, this allows for the orchestration process to decide what tests need to get run on which machines, and if a machine were to say "terminate itself" the Currents servers could just send the rest of the tests in the queue to an existing server or new server.
This becomes really interesting if you are looking to reduce costs of hardware utilizing AWS Spot Instances, which are short lived machines that you can utilize for up to 90% less than dedicated AWS resources. If you are interested in trying this out you will need to reach out to the currents team to configure: [email protected].
An example of a GitHub Actions file that utilizes orchestration. In the below example I create 5 different matrix/shards via GitHub actions which just says run 5 machines, and then pass the same commands to each of them to prepare the machine for Playwright, set the Currents environment variables, and run the playwright currents orchestration command.
name: Currents GHA
on:
  pull_request:
    branches: [main]
  push:
    branches: [main]
  workflow_dispatch:
    inputs:
      app_url:
        description: "APP URL, to run tests against"
        required: true
        default: https://www.automationexercise.com
jobs:
  basicTests:
    strategy:
      fail-fast: false
      matrix:
        shard: [1, 2, 3, 4, 5]
    name: "PW tests"
    timeout-minutes: 60
    runs-on: ubuntu-22.04
    container: mcr.microsoft.com/playwright:latest
    env:
      TESTGROUP: basic
    steps:
      - uses: actions/checkout@v4
        with:
          ref: ${{ github.event.pull_request.head.sha }}

      # https://github.com/actions/runner-images/issues/6775
      - run: |
          echo "$GITHUB_WORKSPACE"
          git config --global --add safe.directory "$GITHUB_WORKSPACE"

      - uses: actions/setup-node@v4
        with:
          node-version: "18.x"

      - name: Install dependencies
        run: |
          npm ci
          npx playwright install chrome

      - name: Run Orchestrated tests
        continue-on-error: false
        env:
          CURRENTS_PROJECT_ID: ${{ secrets.CURRENTS_PROJECT_ID }}
          CURRENTS_RECORD_KEY: ${{ secrets.CURRENTS_RECORD_KEY }}
          CURRENTS_CI_BUILD_ID: reporter-${{ github.repository }}-${{ github.run_id }}-${{ github.run_attempt }}
          COMMIT_INFO_MESSAGE: "pwc-p: ${{ github.event.head_commit.message }}"
        run: |
          npx pwc-p --project projectA --grep-invert @axe
Exploring the Playwright Dashboard
So far we have spent a lot of time going over the different ways to configure the Currents service and integrate them into your repositories. From here on out I'll focus on the Currents Dashboard and it's features.
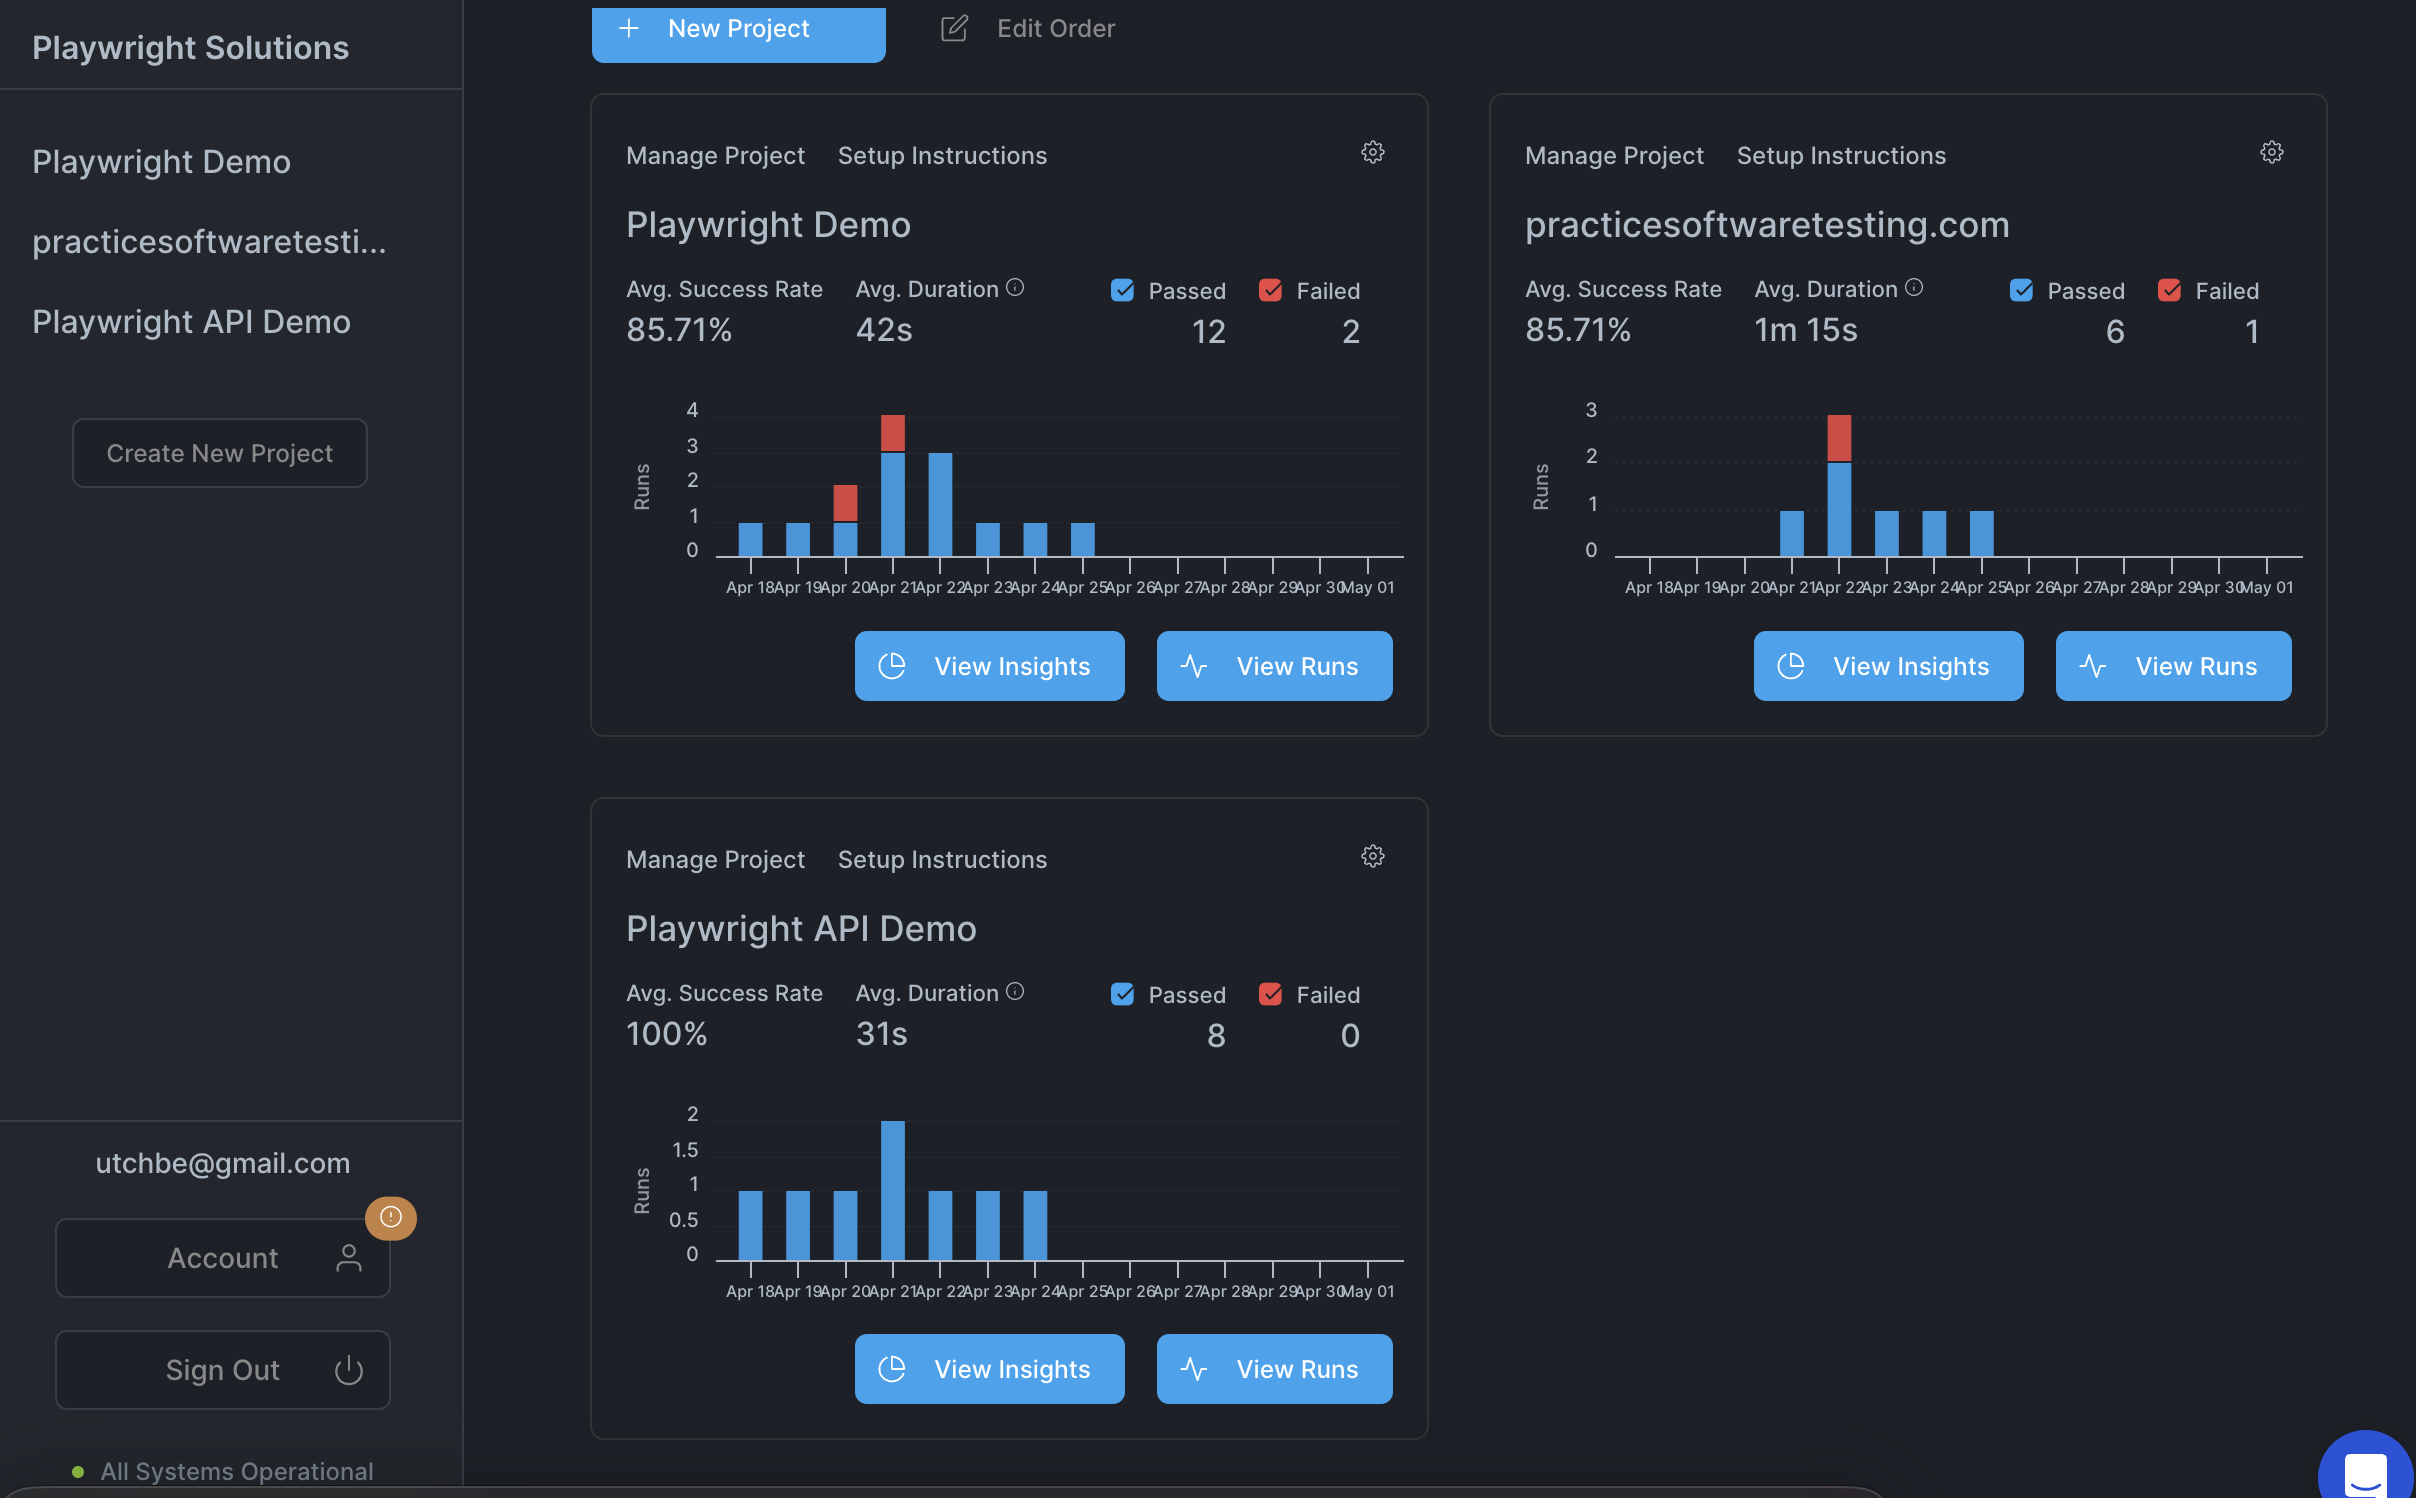
Main Dashboard
I've found this main dashboard view is really useful for when I want to look at the highest level with an overview to all my projects and their recent trends. Working with larger teams this is where the managers, directors, VP, or CTO may spend their time. What's nice about this view is you can quickly have a decent idea of the quality of the work being done either by the team writing test automation or the product code that is under test based on the number of failures in each project. You also have access to the average duration which can also be useful to determine if there is a need to adjust the orchestration as your project grows.
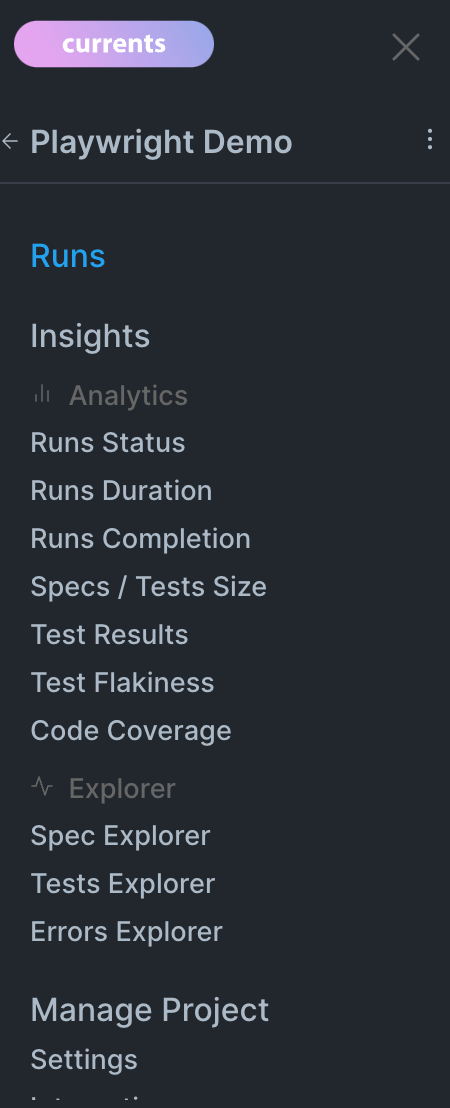
Once you click on one of the projects you will have access to the following links in the Sidebar. I'll cover many of these views in the following sections.
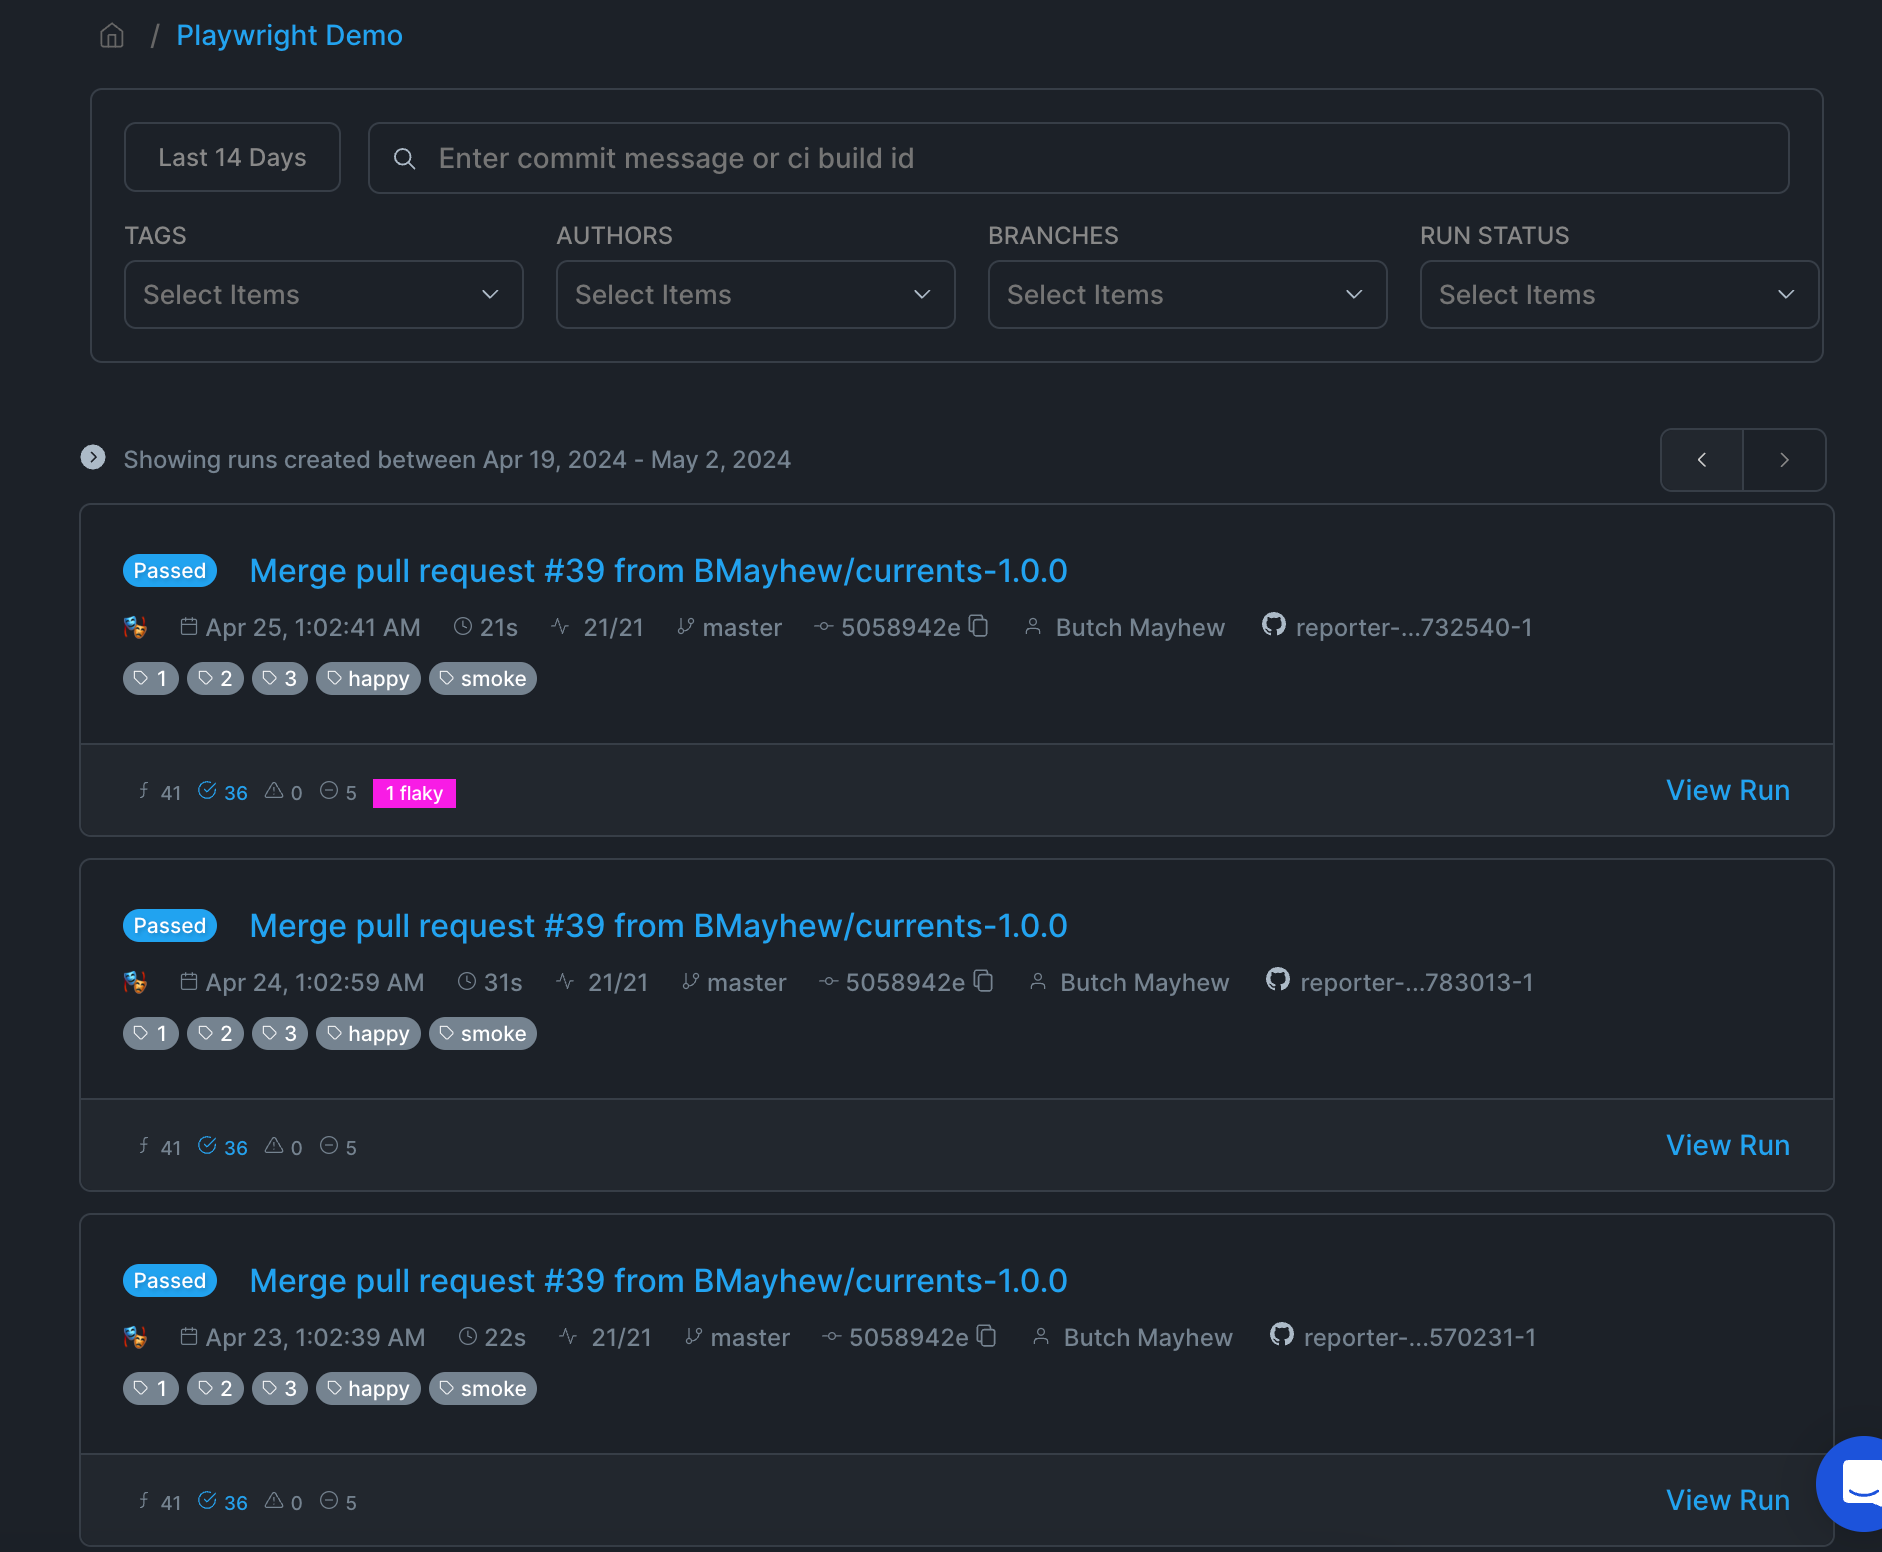
Runs Overview
The runs section is typically where I found myself debugging and troubleshooting tests while using the dashboard. This section contains all the details of each run. The high level view below is the starting point where each "Run" has a summary which includes a lot of information including if the test was tagged as flakey (from passing after a retry).
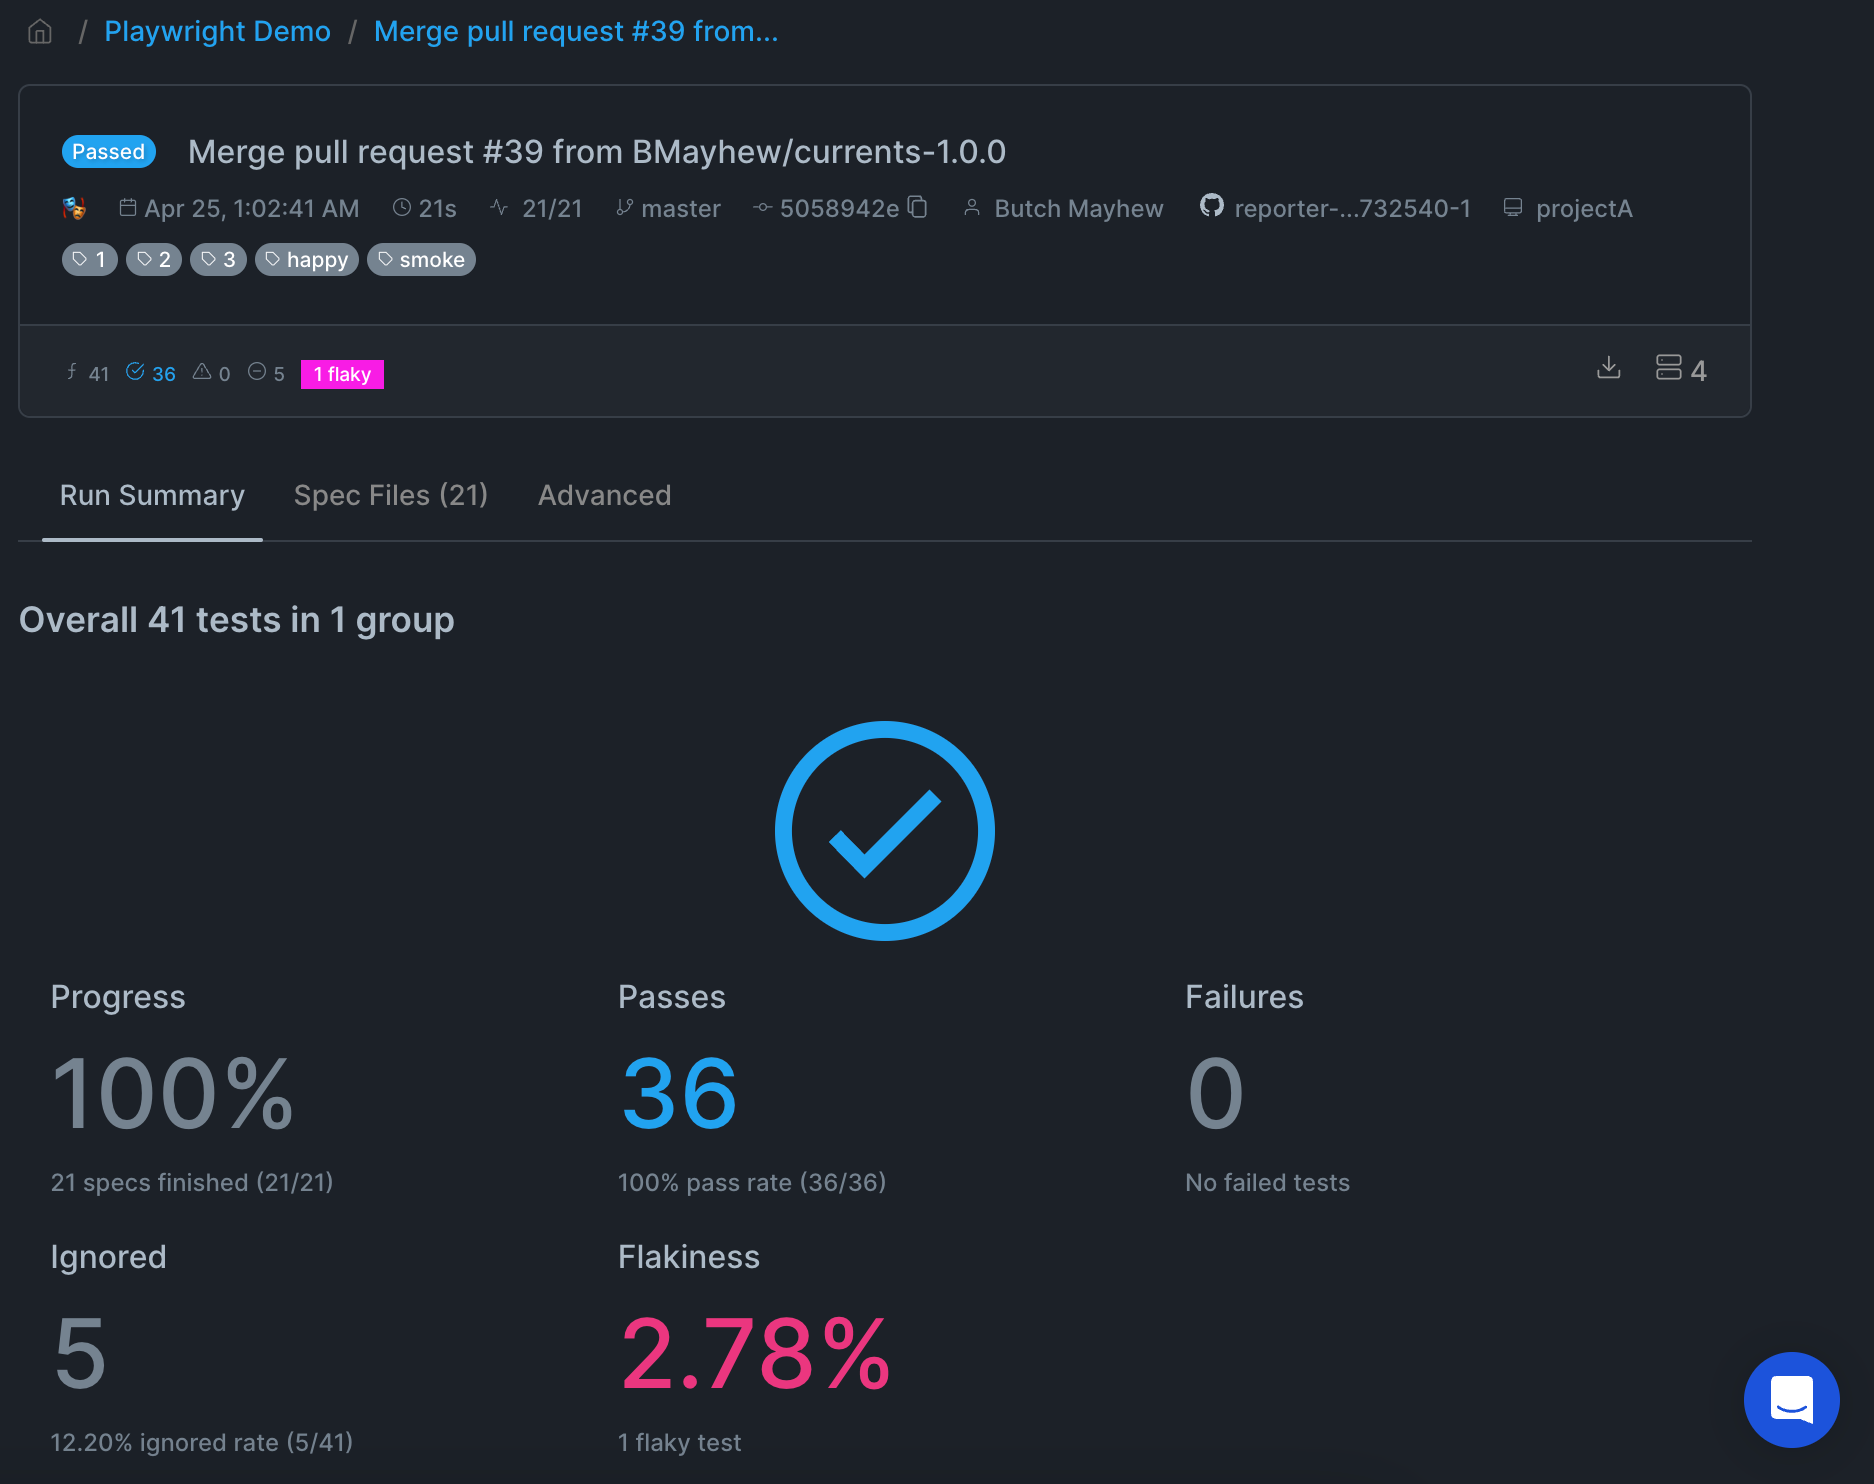
Runs Overview > Specific Run Summary
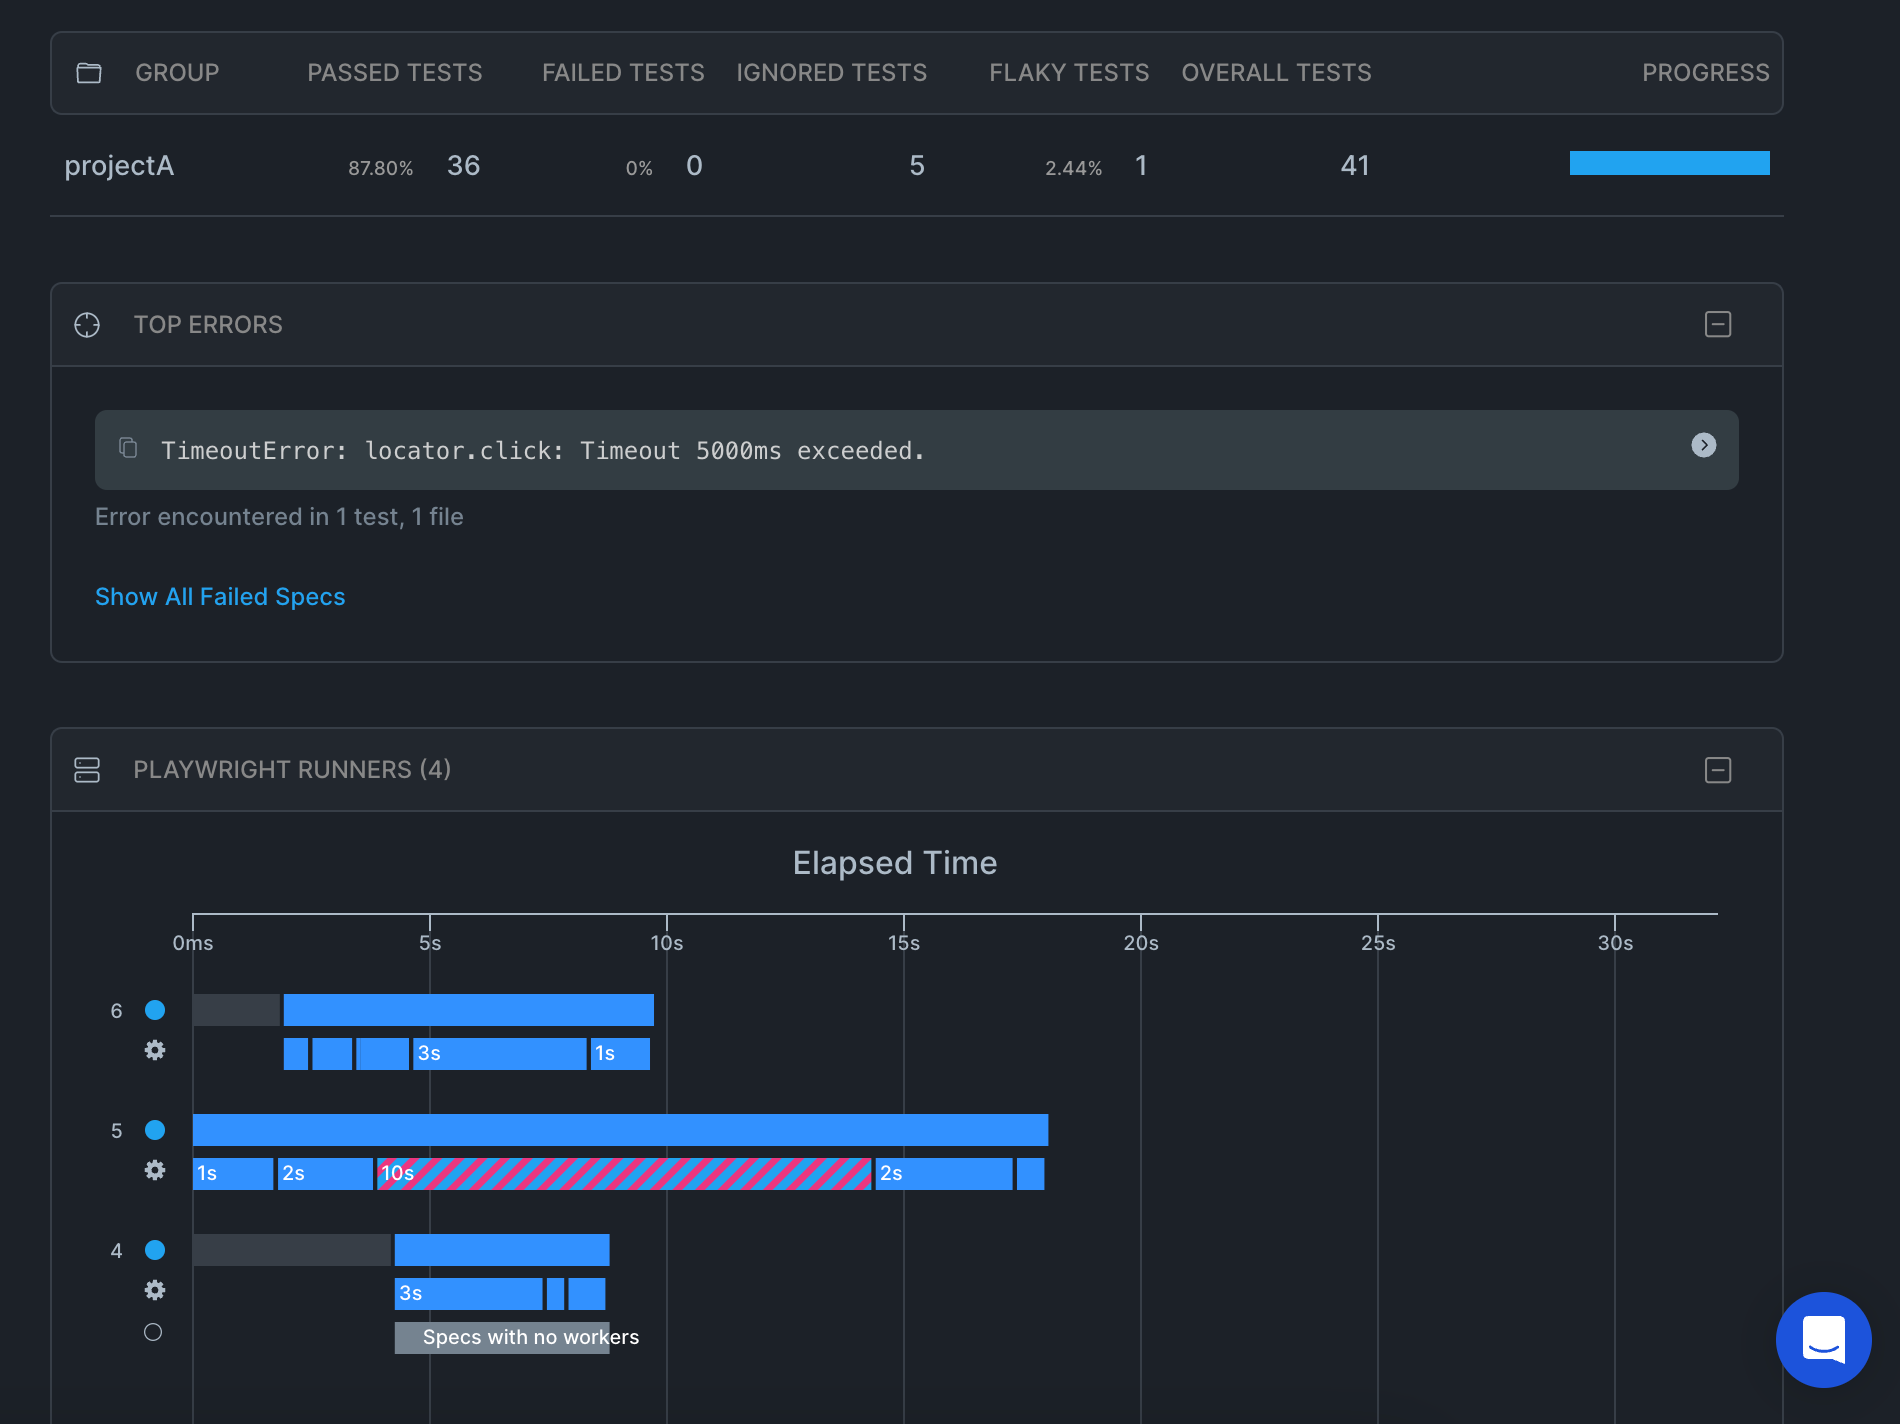
As you click into one of the runs, you will see a similar card with the details of the run along some details of the specific run including a flakiness rate. As you scroll down you also see the details around the project groups that were run, top errors of the run, and a visualization of the Playwright runners.
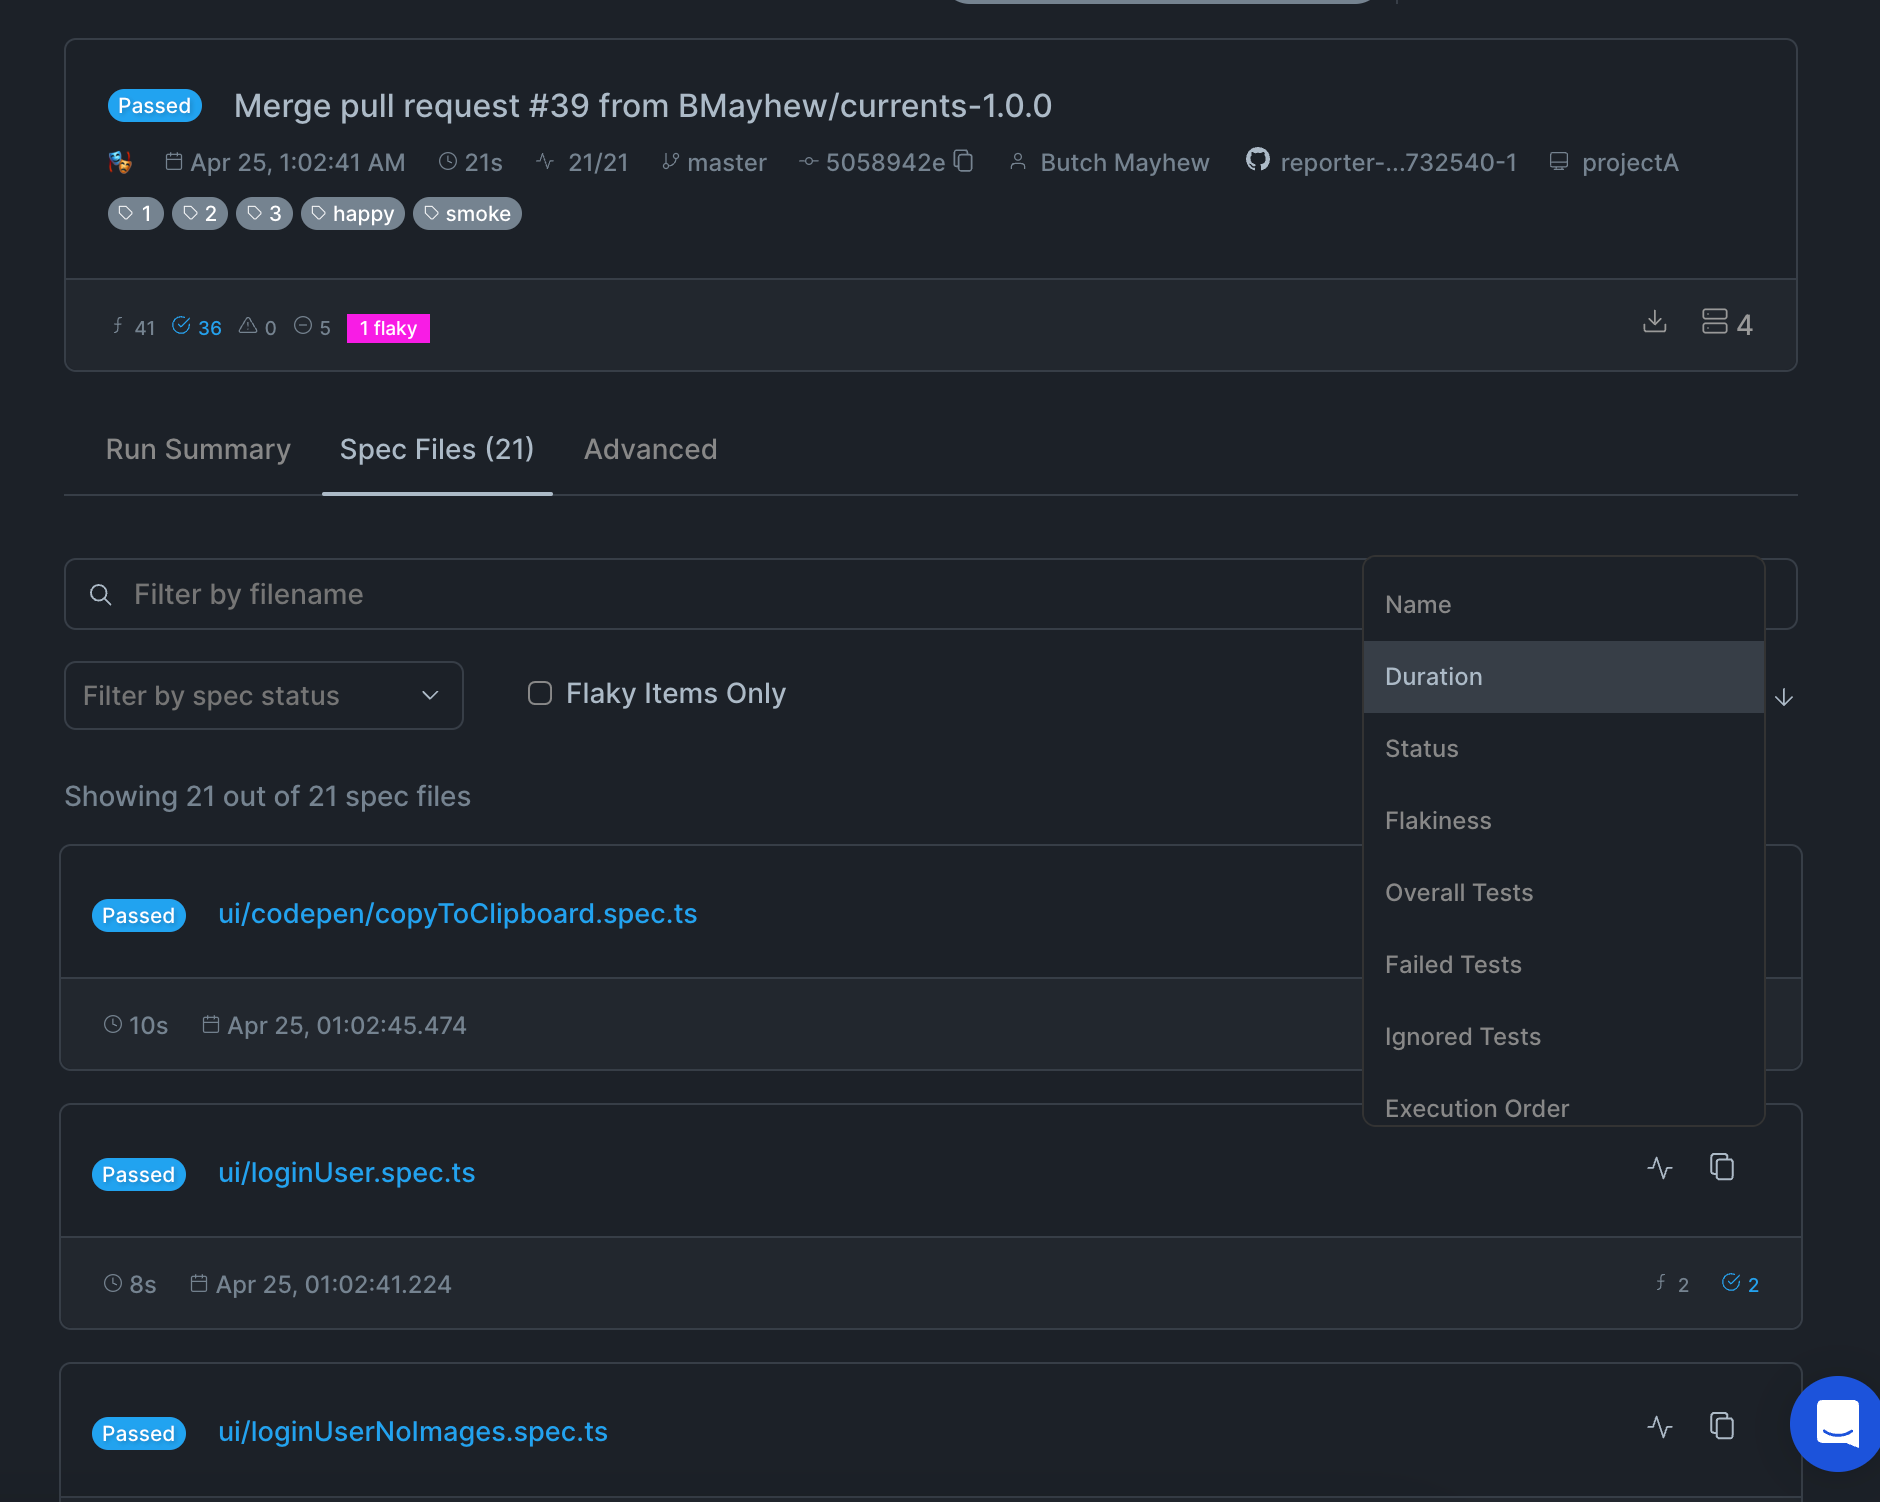
Runs Overview > Specific Run > Spec Files
Clicking on the Spec Files section towards the top of the specific run will take you to a view that I found really helpful when maintaining my automation specs. While looking at the spec view it's important to remember each spec may be a single test or multiple tests depending on how you have written your own tests. This view allows you to sort by many different options (see screenshot below). The most valuable sort options in my opinion are:
- Failed Tests - in my context we aren't releasing our code without investigating the risk from a potential failed test, so I will spend most of my time here to research and determine why the test failed, and work toward opening a bug to resolve the application issue or update the automation to account for changes.
- Duration - helpful for giving feedback on the run time for a specific spec file (note this may include multiple tests).
- Flakiness - which is helpful information for either exploring the system under test at a deeper level where they may be an intermittent bug or for finding and resolving an issue in my test code.
- Overall Tests - This will sort the specs based on how many test blocks are within the spec.
There are lots of other links and hover overs on this page that lead to other pages and features that you should explore for yourself! Next we will go ahead and click on one of the spec files and explore there.
Runs Overview > Specific Run > Spec Files > Spec File
This is where teams that manage test automation really start to feel the power of this dashboard. On this view you have an overload of data to help you make the best decision possible. The first 6 graphs show relevant information to the specific spec file that you are inspecting. The purple values and lines on the graphs provide the average values of the current period while the white values and lines reflect the previous period. This period can be adjusted using the Dropdown (defaults to 14-days). This is really helpful to help visualize and identify trends. For example if you had an issue with an automated test that always failed on Tuesday between 3:00PM and Wednesday 4:00AM, this visualization would make it easy to see that and lead to quicker resolution.
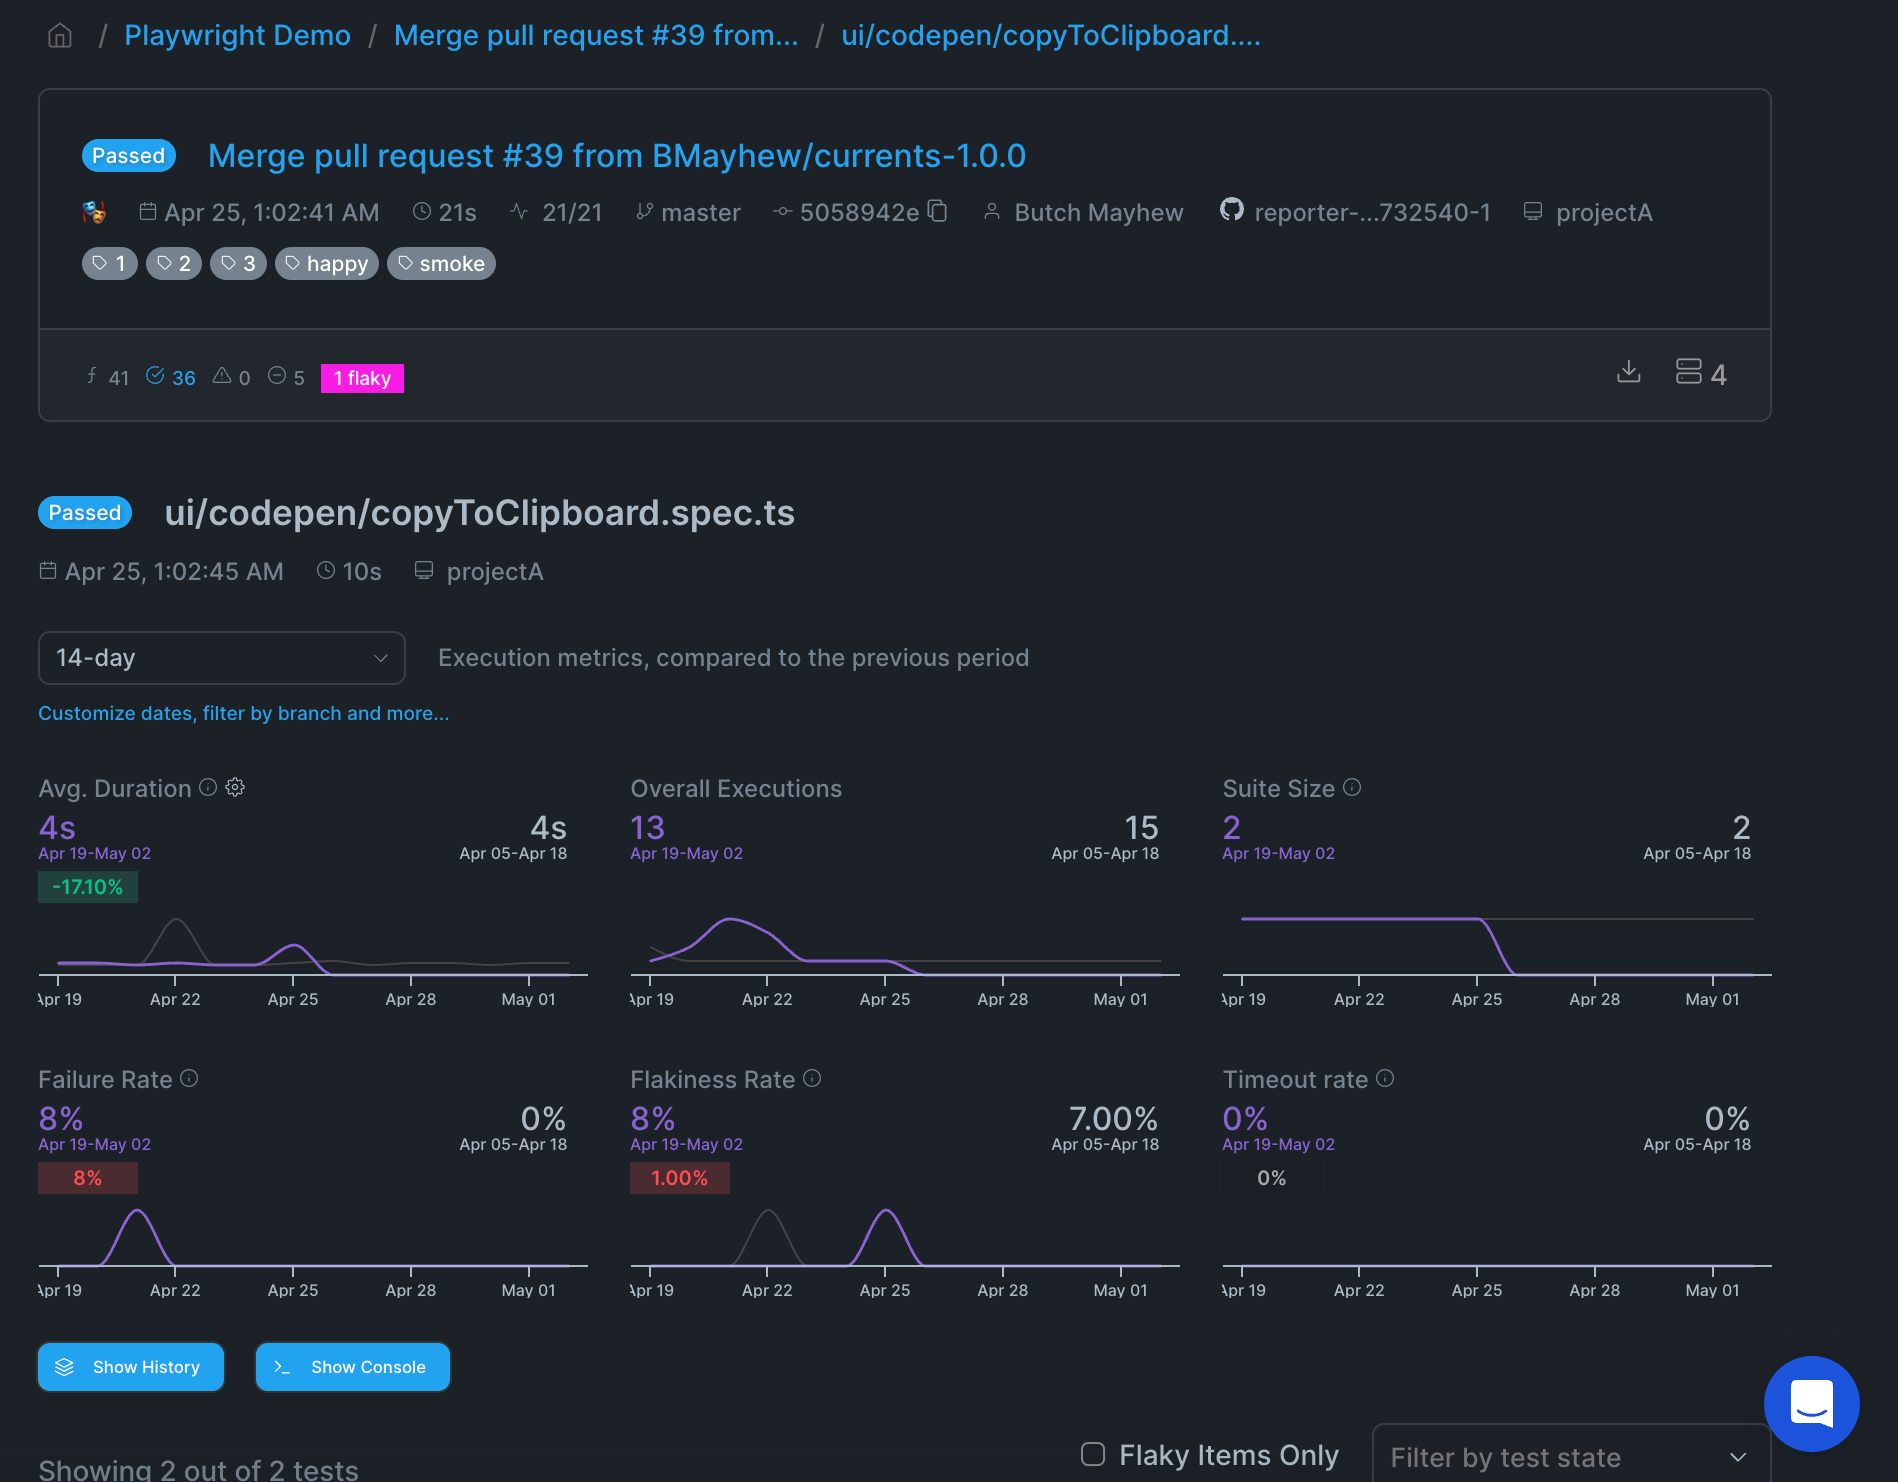
The bottom section has the details you would expect any Playwright Test reporter to include. Screenshots, video recording, Playwright Trace Viewer, and the details of the error. What's nice is for retry attempts you still have access to details about both attempts, as you would in the default Playwright HTML reporter.
Insights
This next set of visualizations is apart of the Insights that the Currents Dashboard provides. The first 3 reports are focused on looking at the test runs, this is the entire suite running. The following report Specs/Test Size focuses on the spec files, and the final 2 reports look at insights from the test level.
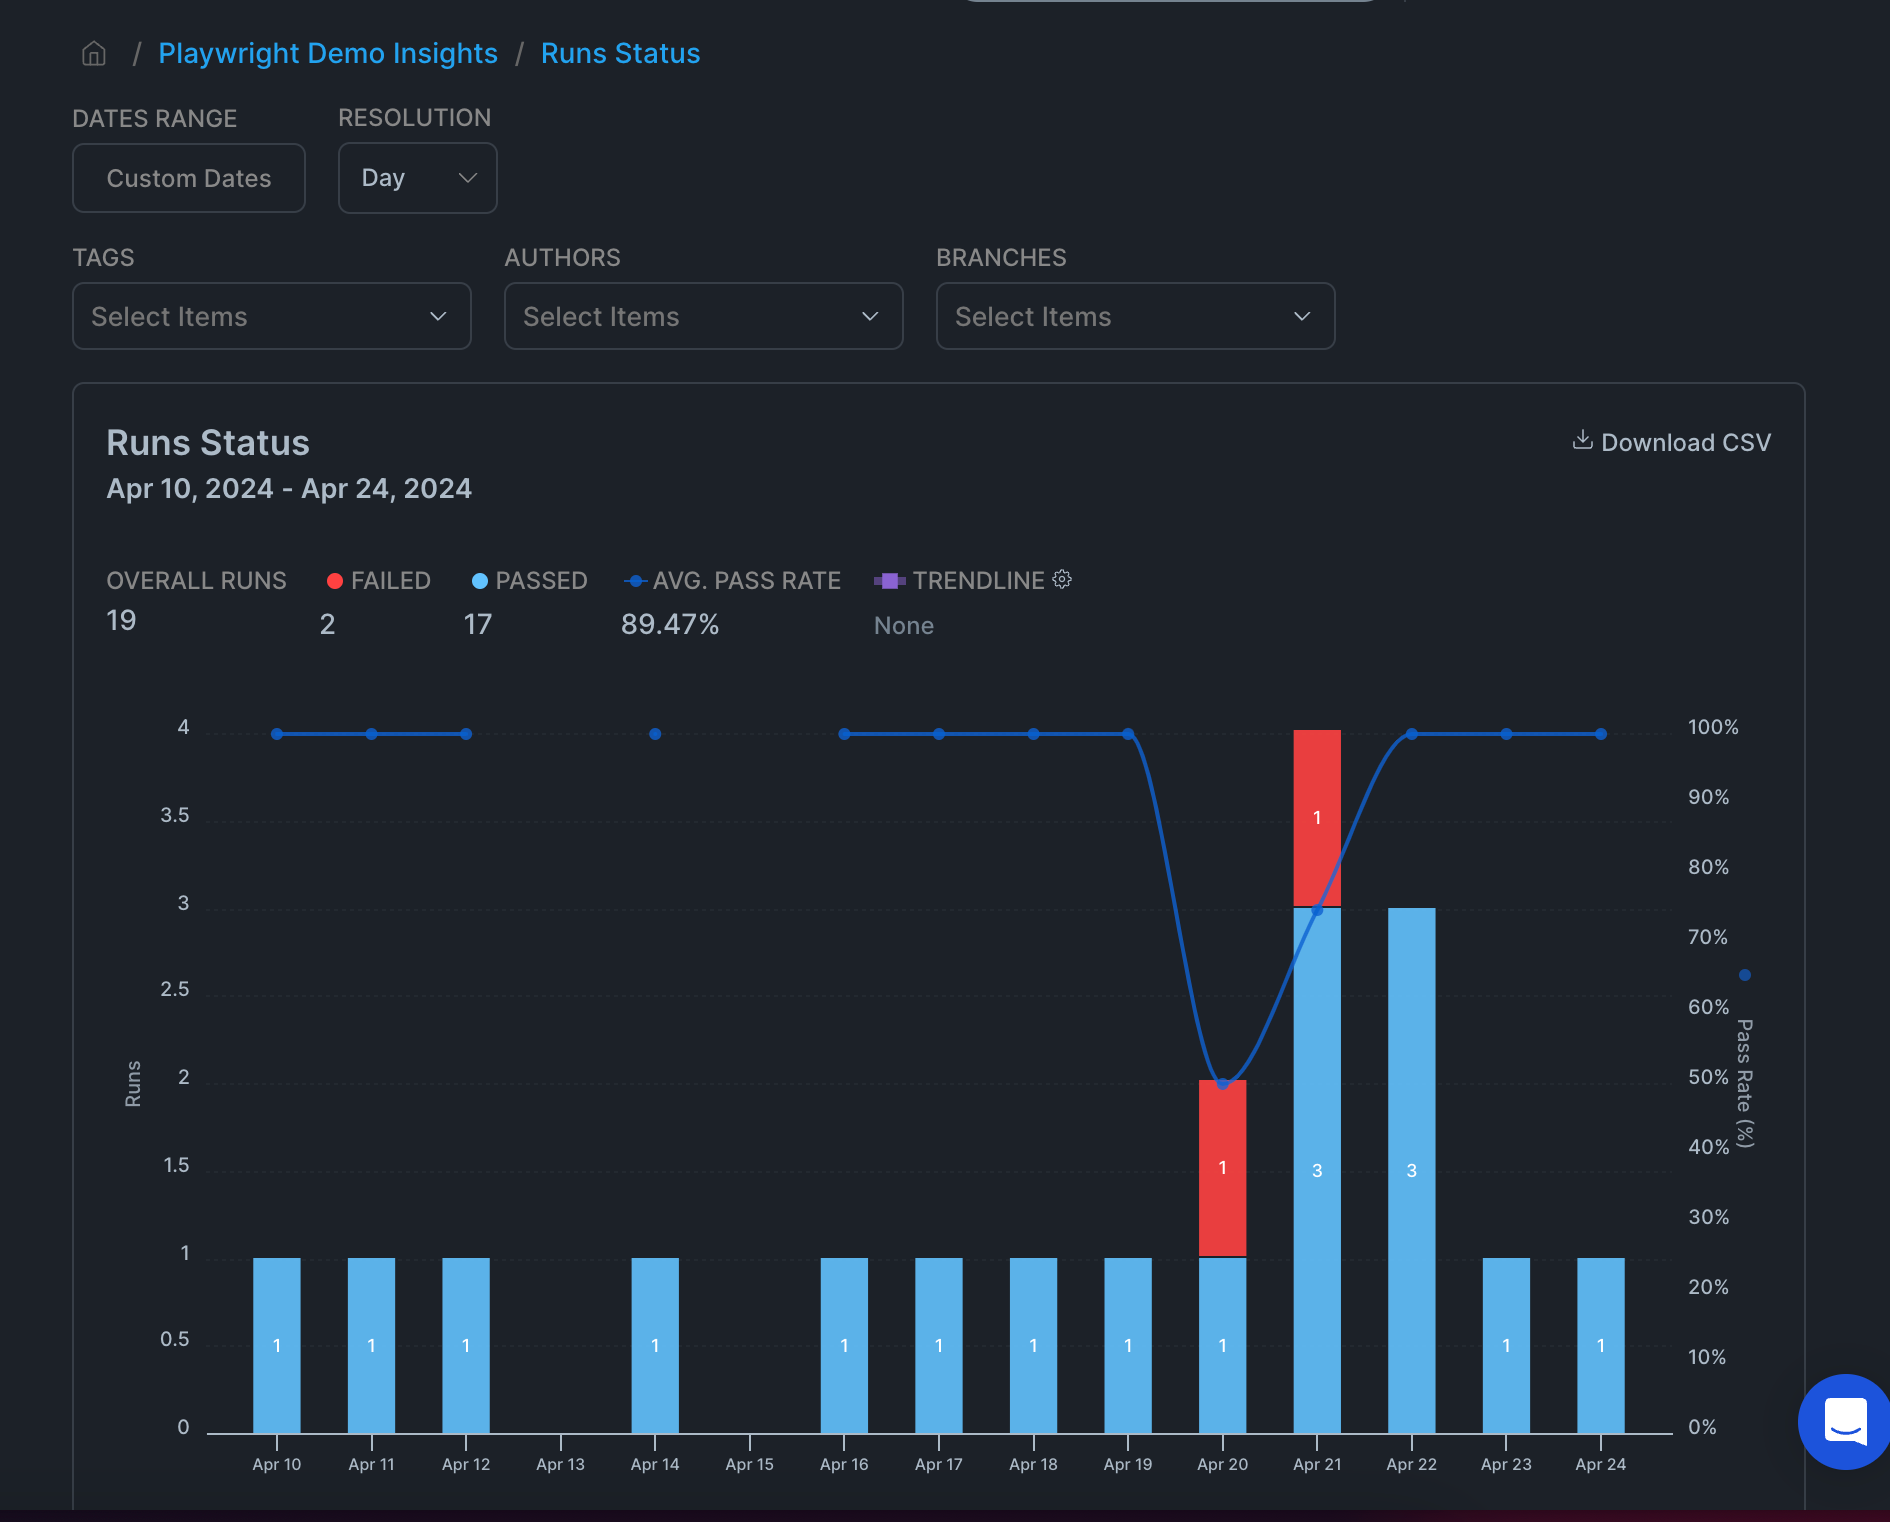
Insights - Runs Status
This next section provides a zoomed in view of the runs and their statuses. One thing to note is being able to filter by tags, author, and code branches could be helpful in trying to review the data trends. I could see this being really helpful for larger teams who rely heavily on tagging for code ownership. This would quickly allow an individual to track the run statuses by the tags they are responsible for.
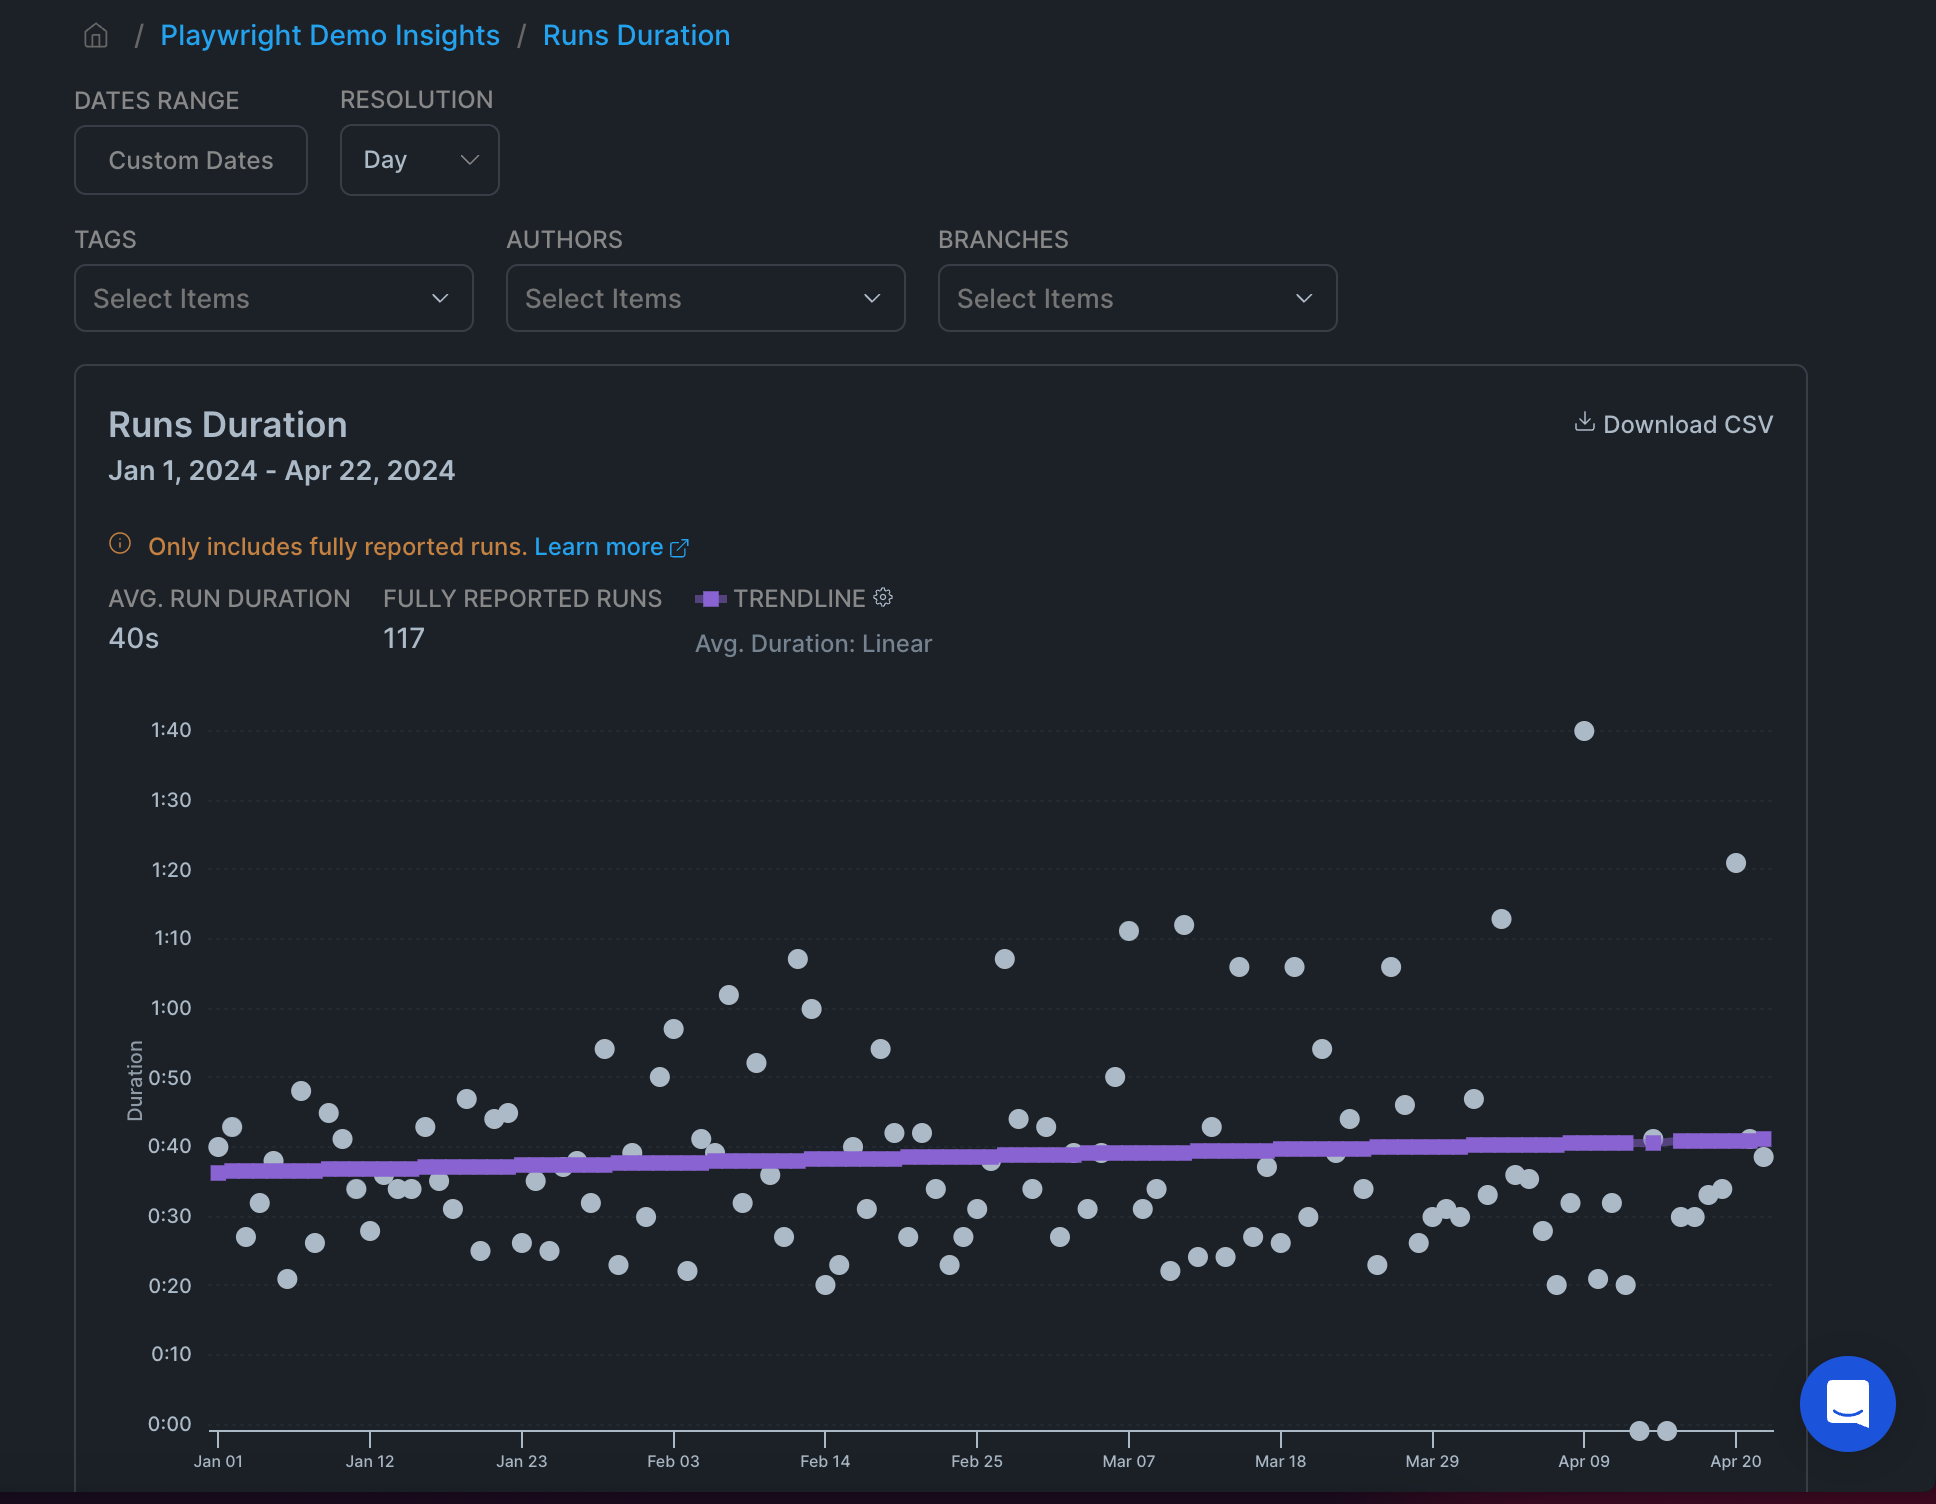
Insights - Run Duration
A helpful graph if you are interested in how the duration of your runs are trending overtime. You are able to enable a trendline and see how you are doing!
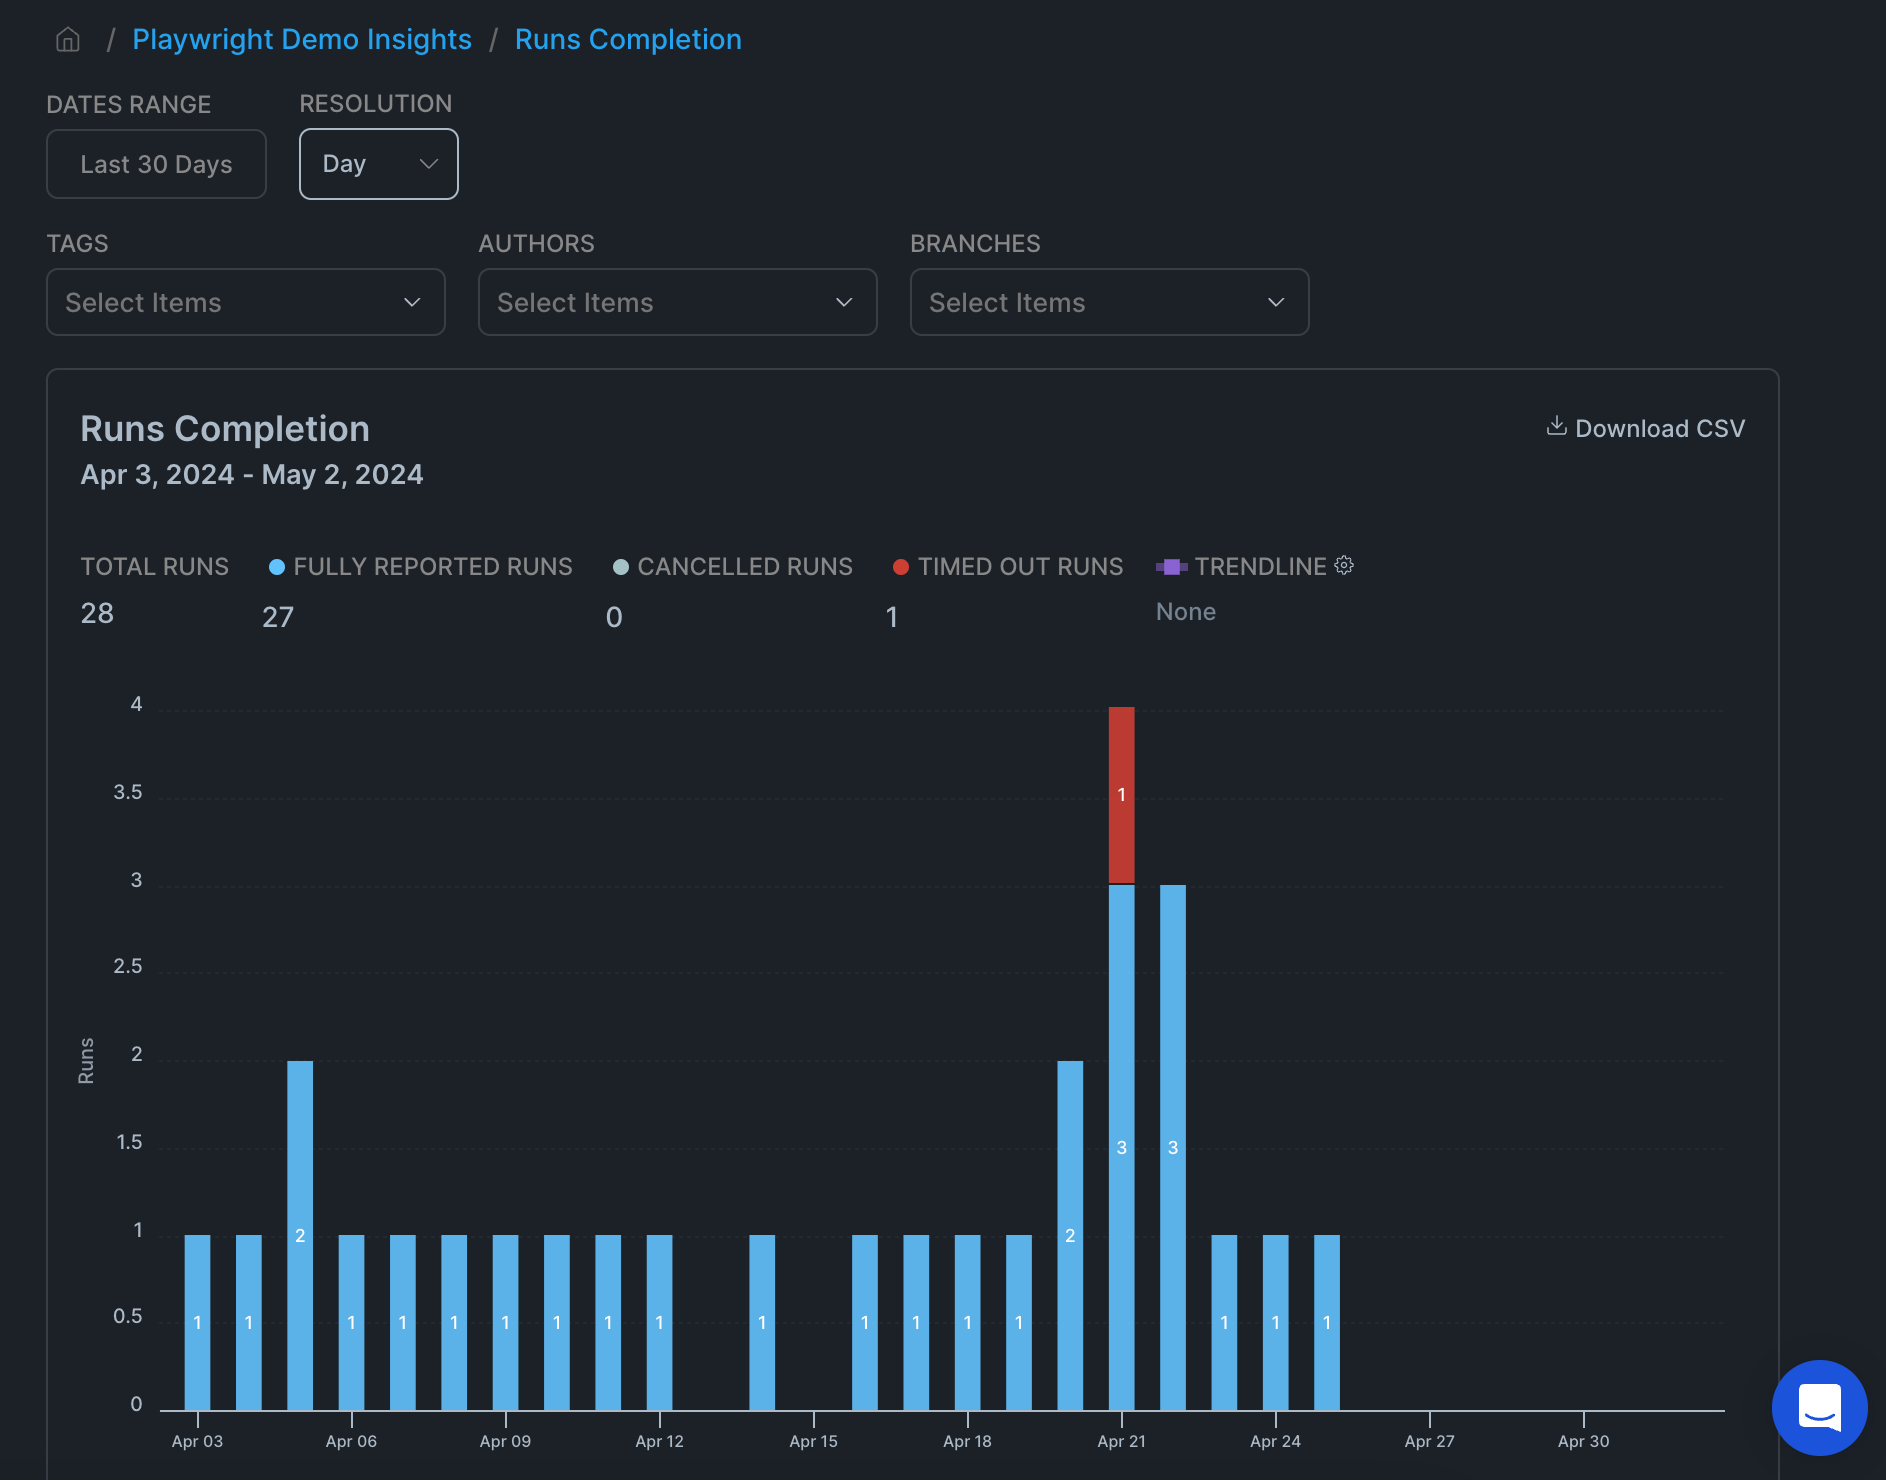
Insights - Run Completion
I didn't see this graph super valuable from my small demo data set but if you have a suite with hundreds or thousands of tests you will more than likely have more canceled and, timed out runs. This information could help identify ways to improve processes or to compare with infrastructure graphs and logs to identify system under test issues.
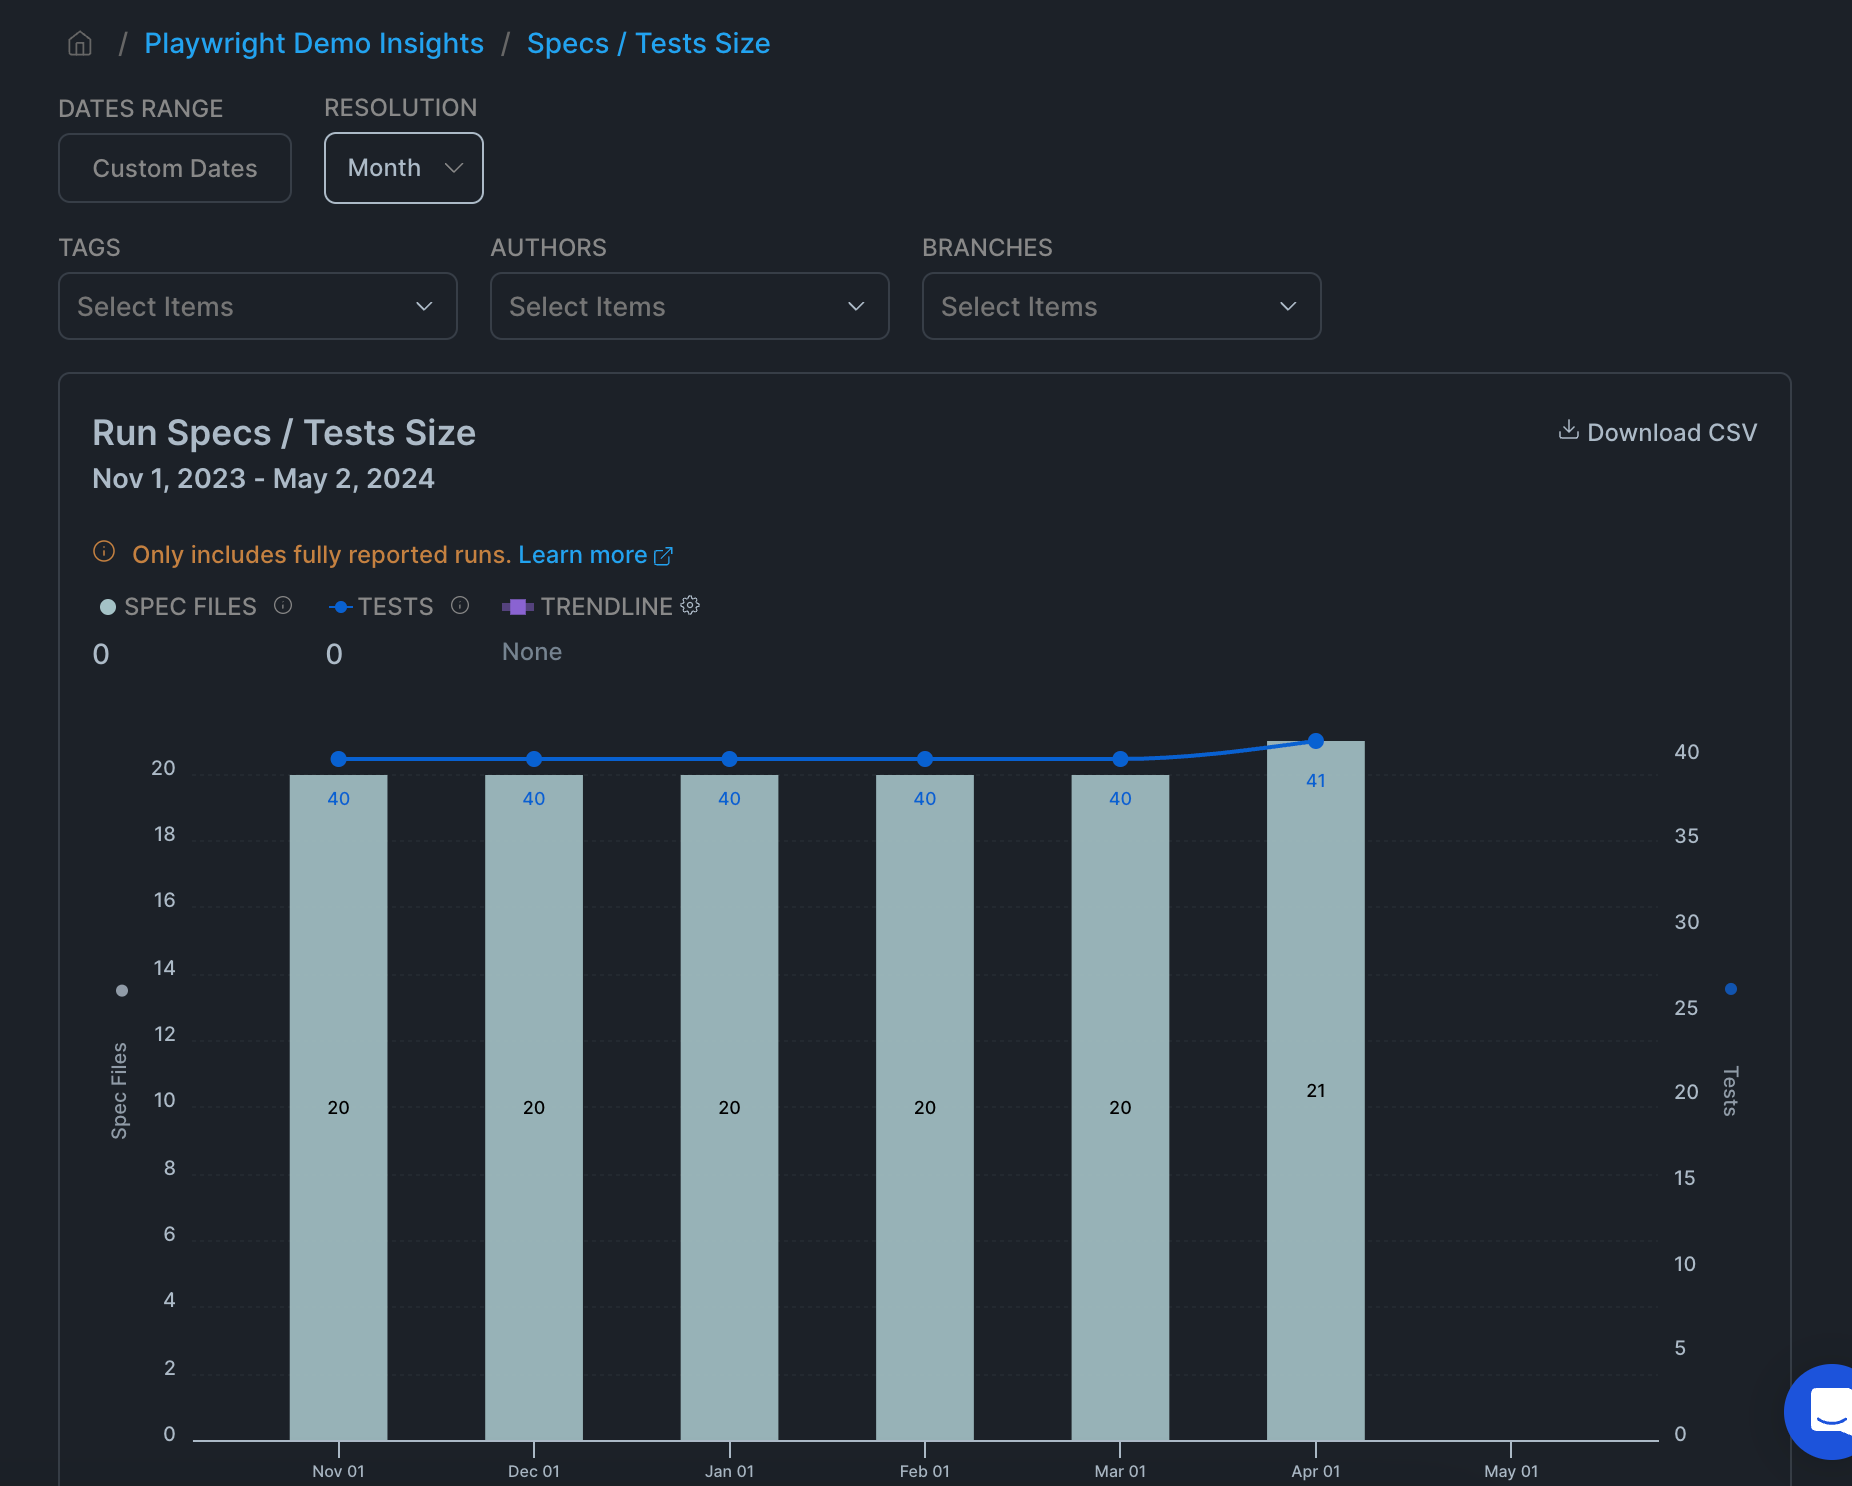
Insights - Specs/Tests Size
This is a great view to help monitor progress on how many new spec files and tests within those specs are being added to the repository on a daily, weekly, or monthly timeframe. I could see this being most useful at the beginning of an automation project where there may be a product that is already built and needs test automation coverage, as there will typically be goals around progress made whenever a project like this gets a green light. Though this graph doesn't help you know how many tests you need it is helpful in seeing the trends over time as tests get added and removed.
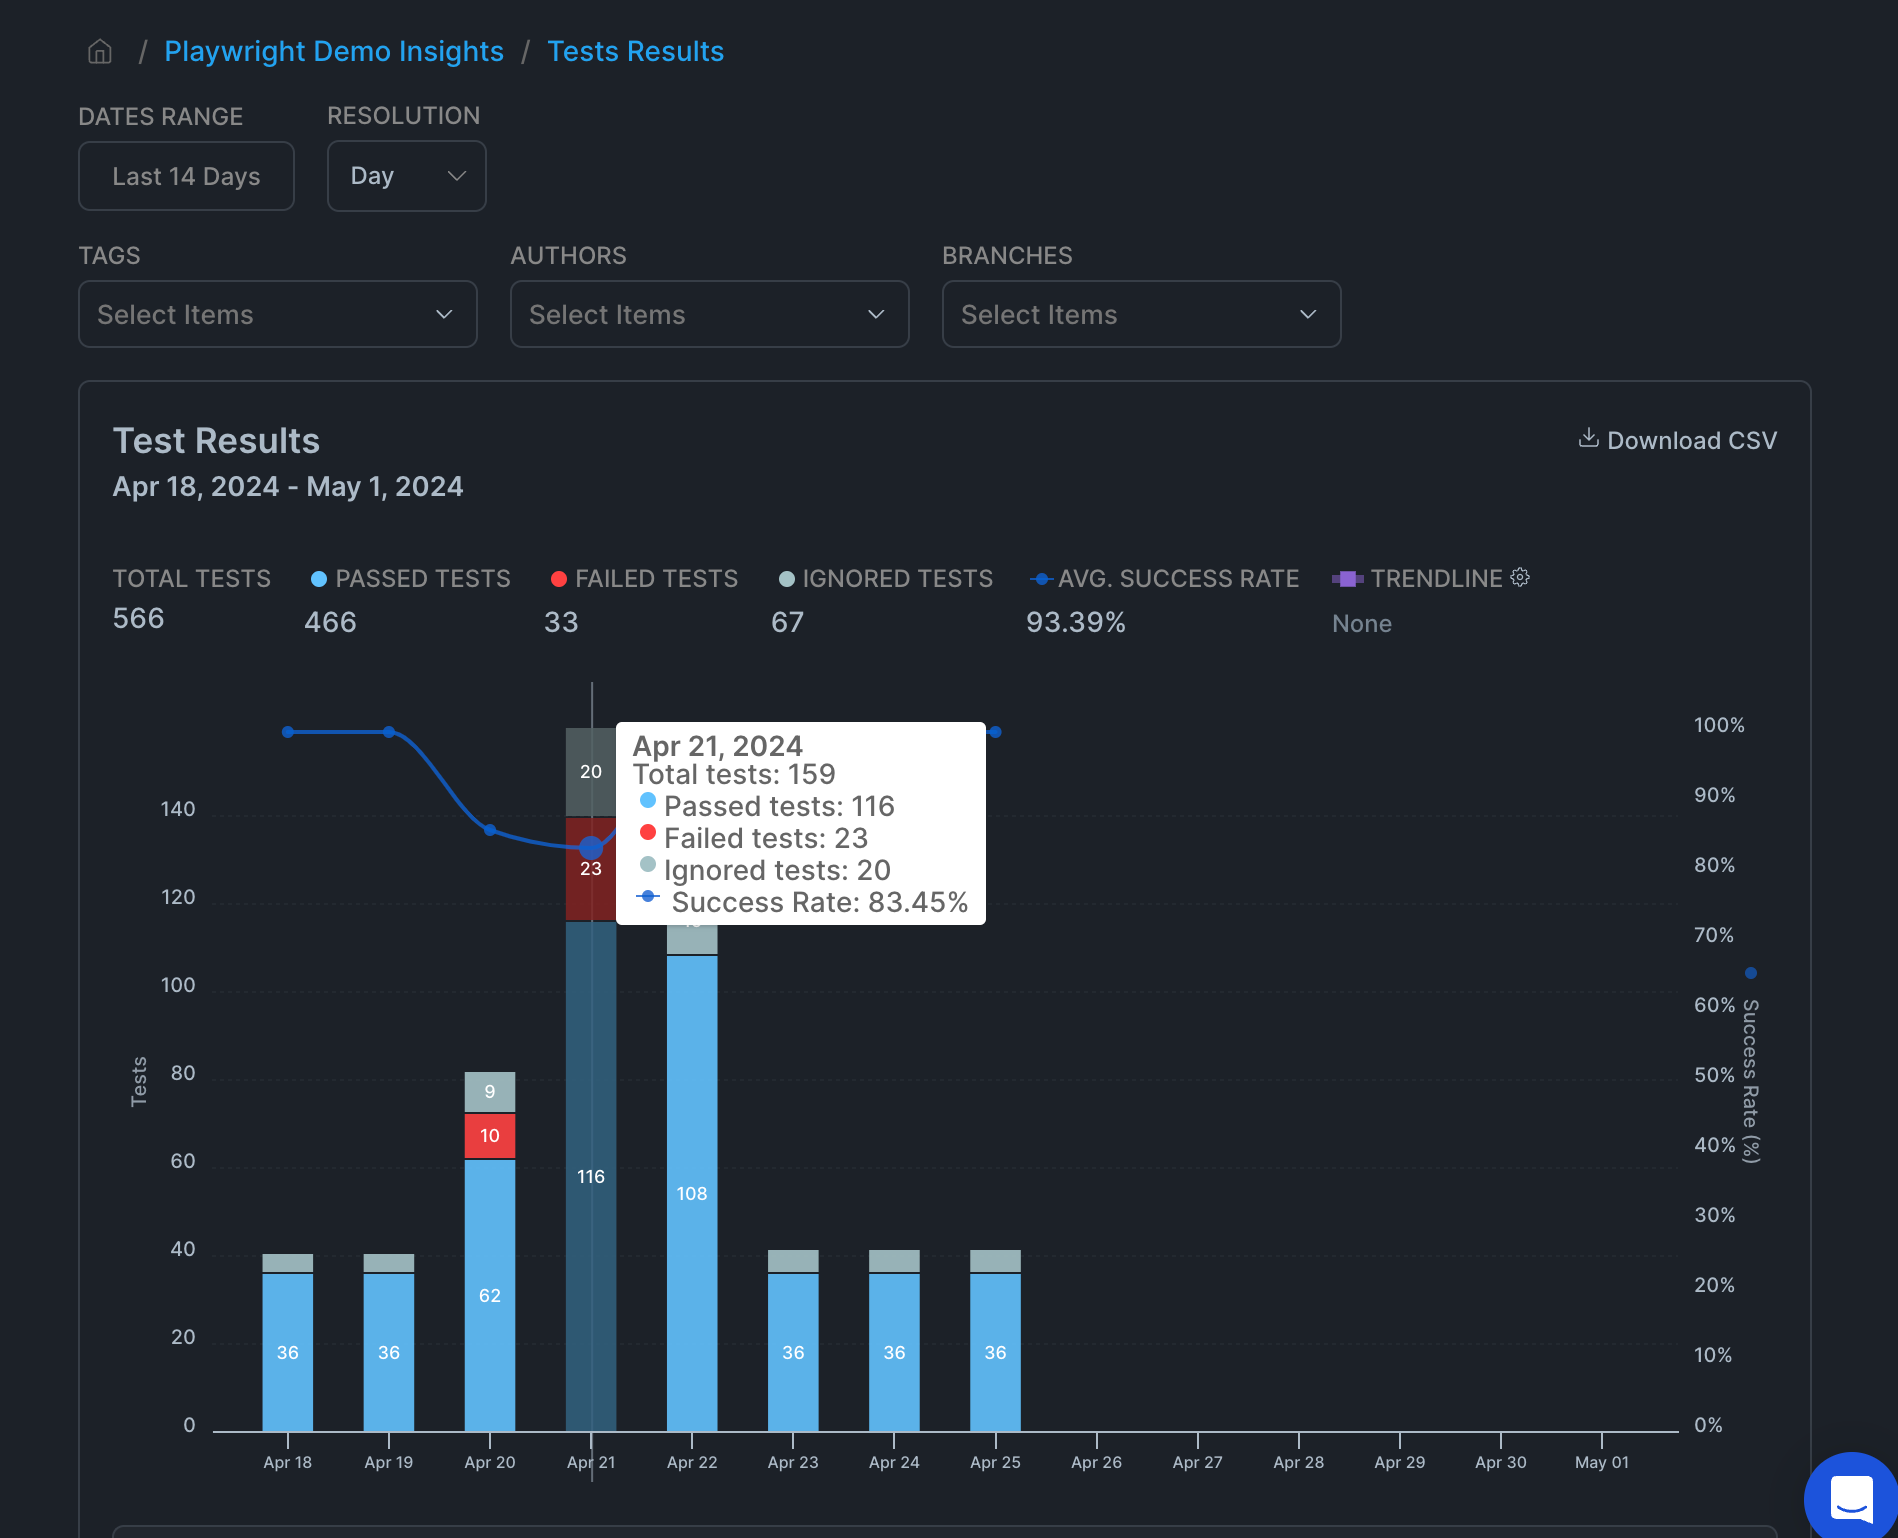
Insights - Test Results
This graph is going back to the test level with a ton of details in giving a high level overview of the specific tests that are run in a given timeframe. When you click on one of the time periods (in this case a day) you will be taken to the "Test Explorer" with the specific time period already selected.
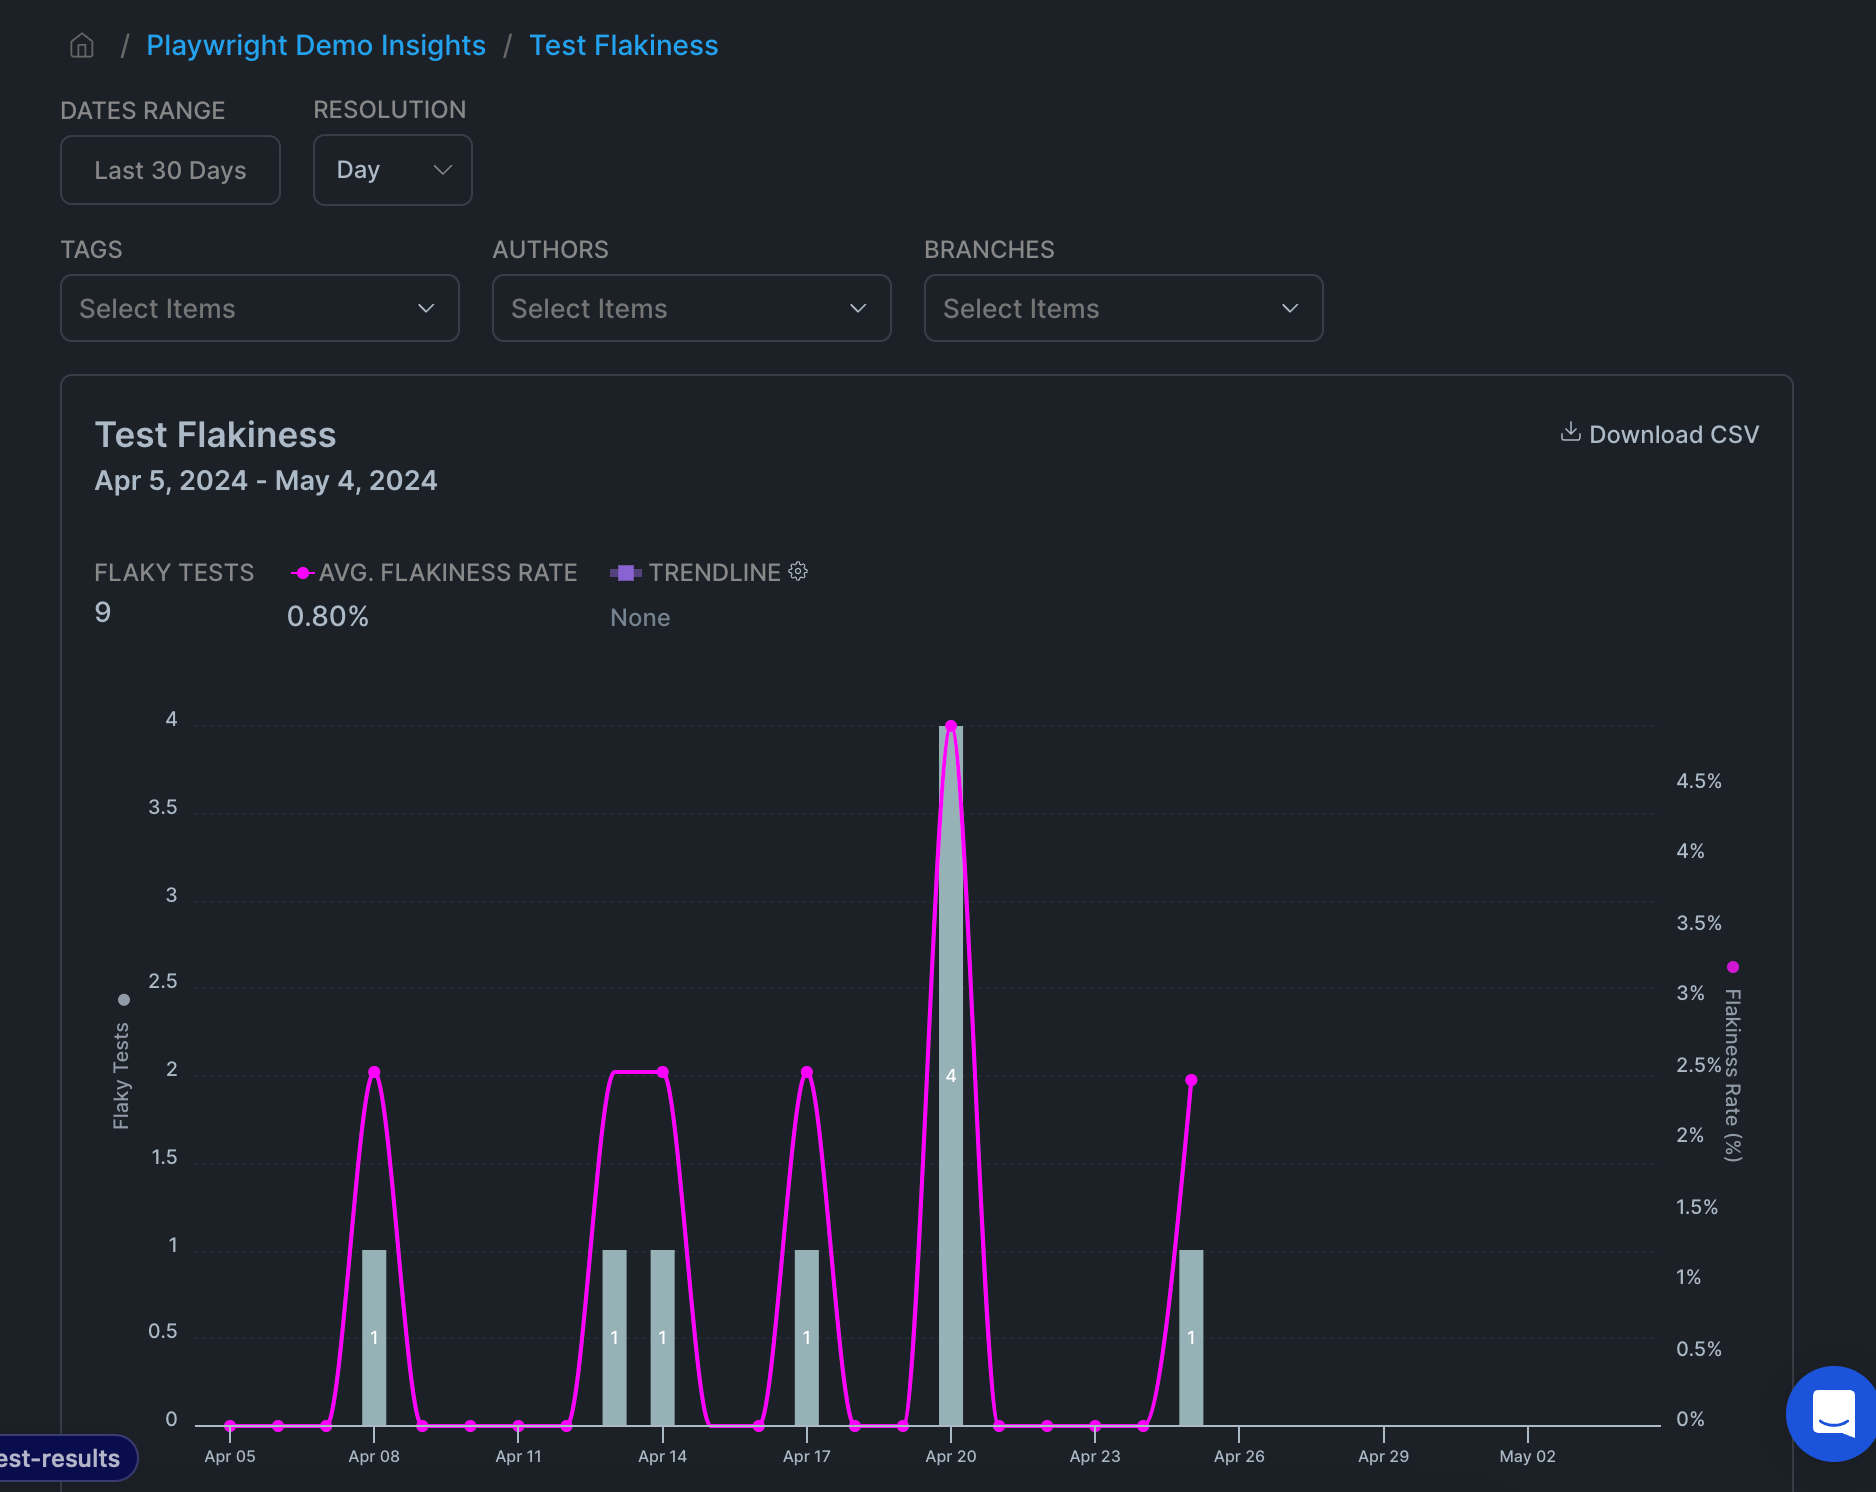
Insights - Test Flakiness
If you are struggling with flakiness in your tests, this graph will help you identify which tests are the most flaky, and as you click into the time period, the test explorer will allow you to see additional details to help you identify your problem areas. This can be extremely useful to keep an eye on as you add new tests. After a week or two of test runs, you should have a good data set around flakey tests.
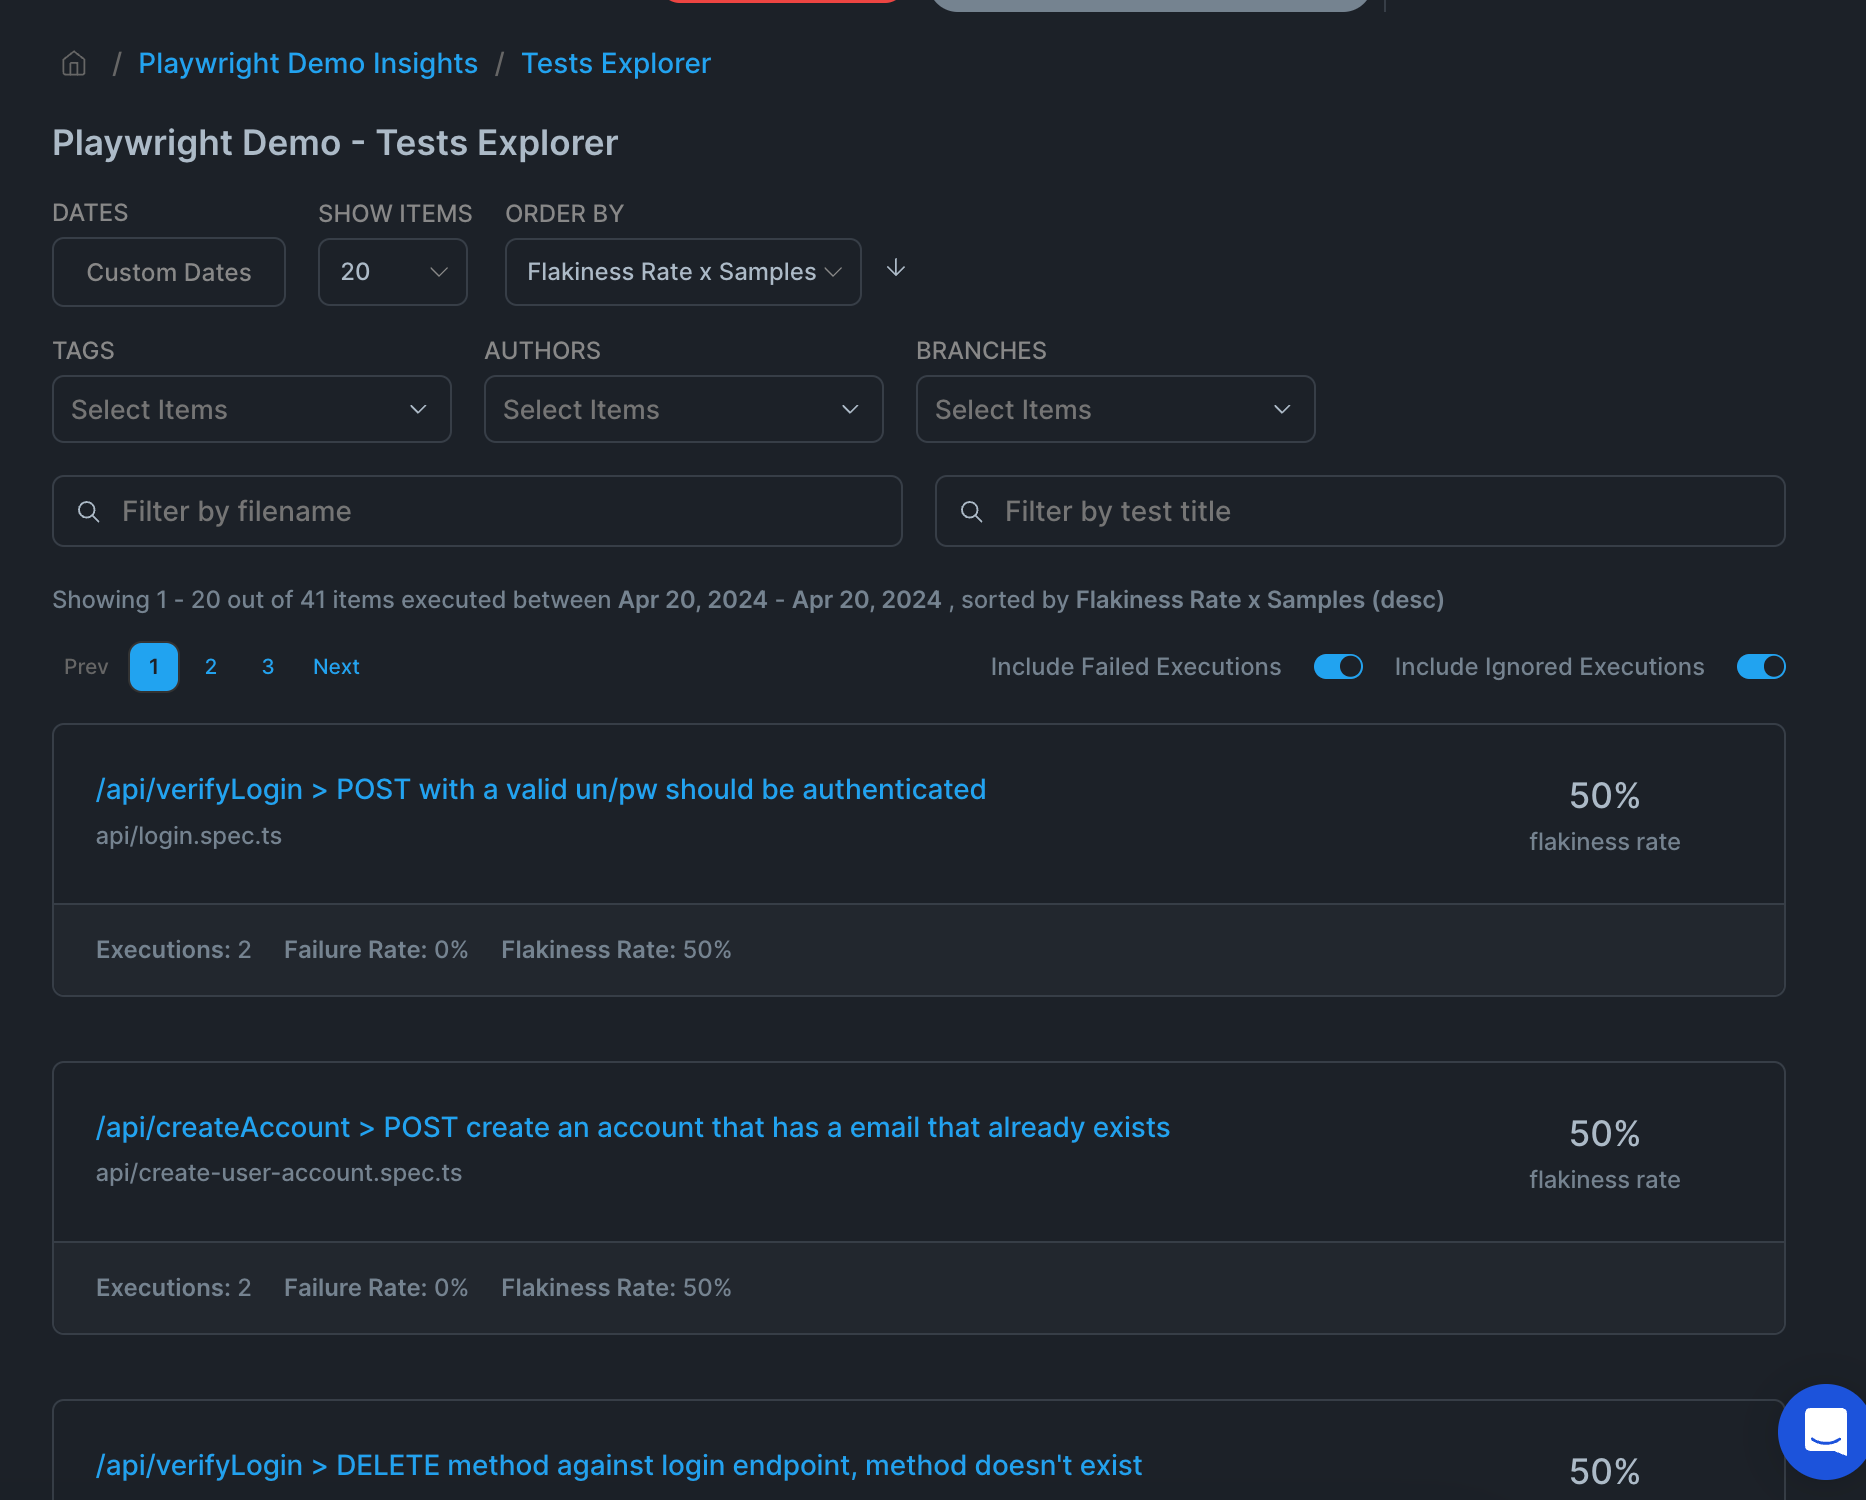
From this view, when you click one of the Flaky tests from the run, you are taken to the List View of Test Explorer which includes the all tests from the day you selected, with the Order By filter set to Flakiness Rate x Samples. This allows you to quickly see the flakey tests at the top of the page, and click into each test which takes you to the Test view of the Test Explorer, for even more details, leading you to the ability see the actual reason the tests failed.
Explorer Views
These next sections are used to create and view data based on the either the spec file (Spec Files Explorer) or the test block (Test Explorer) within your specified date range. This is really useful to individuals or teams managing and monitoring the test automation runs. You'll be able to sus out information that will help improve your test suites.
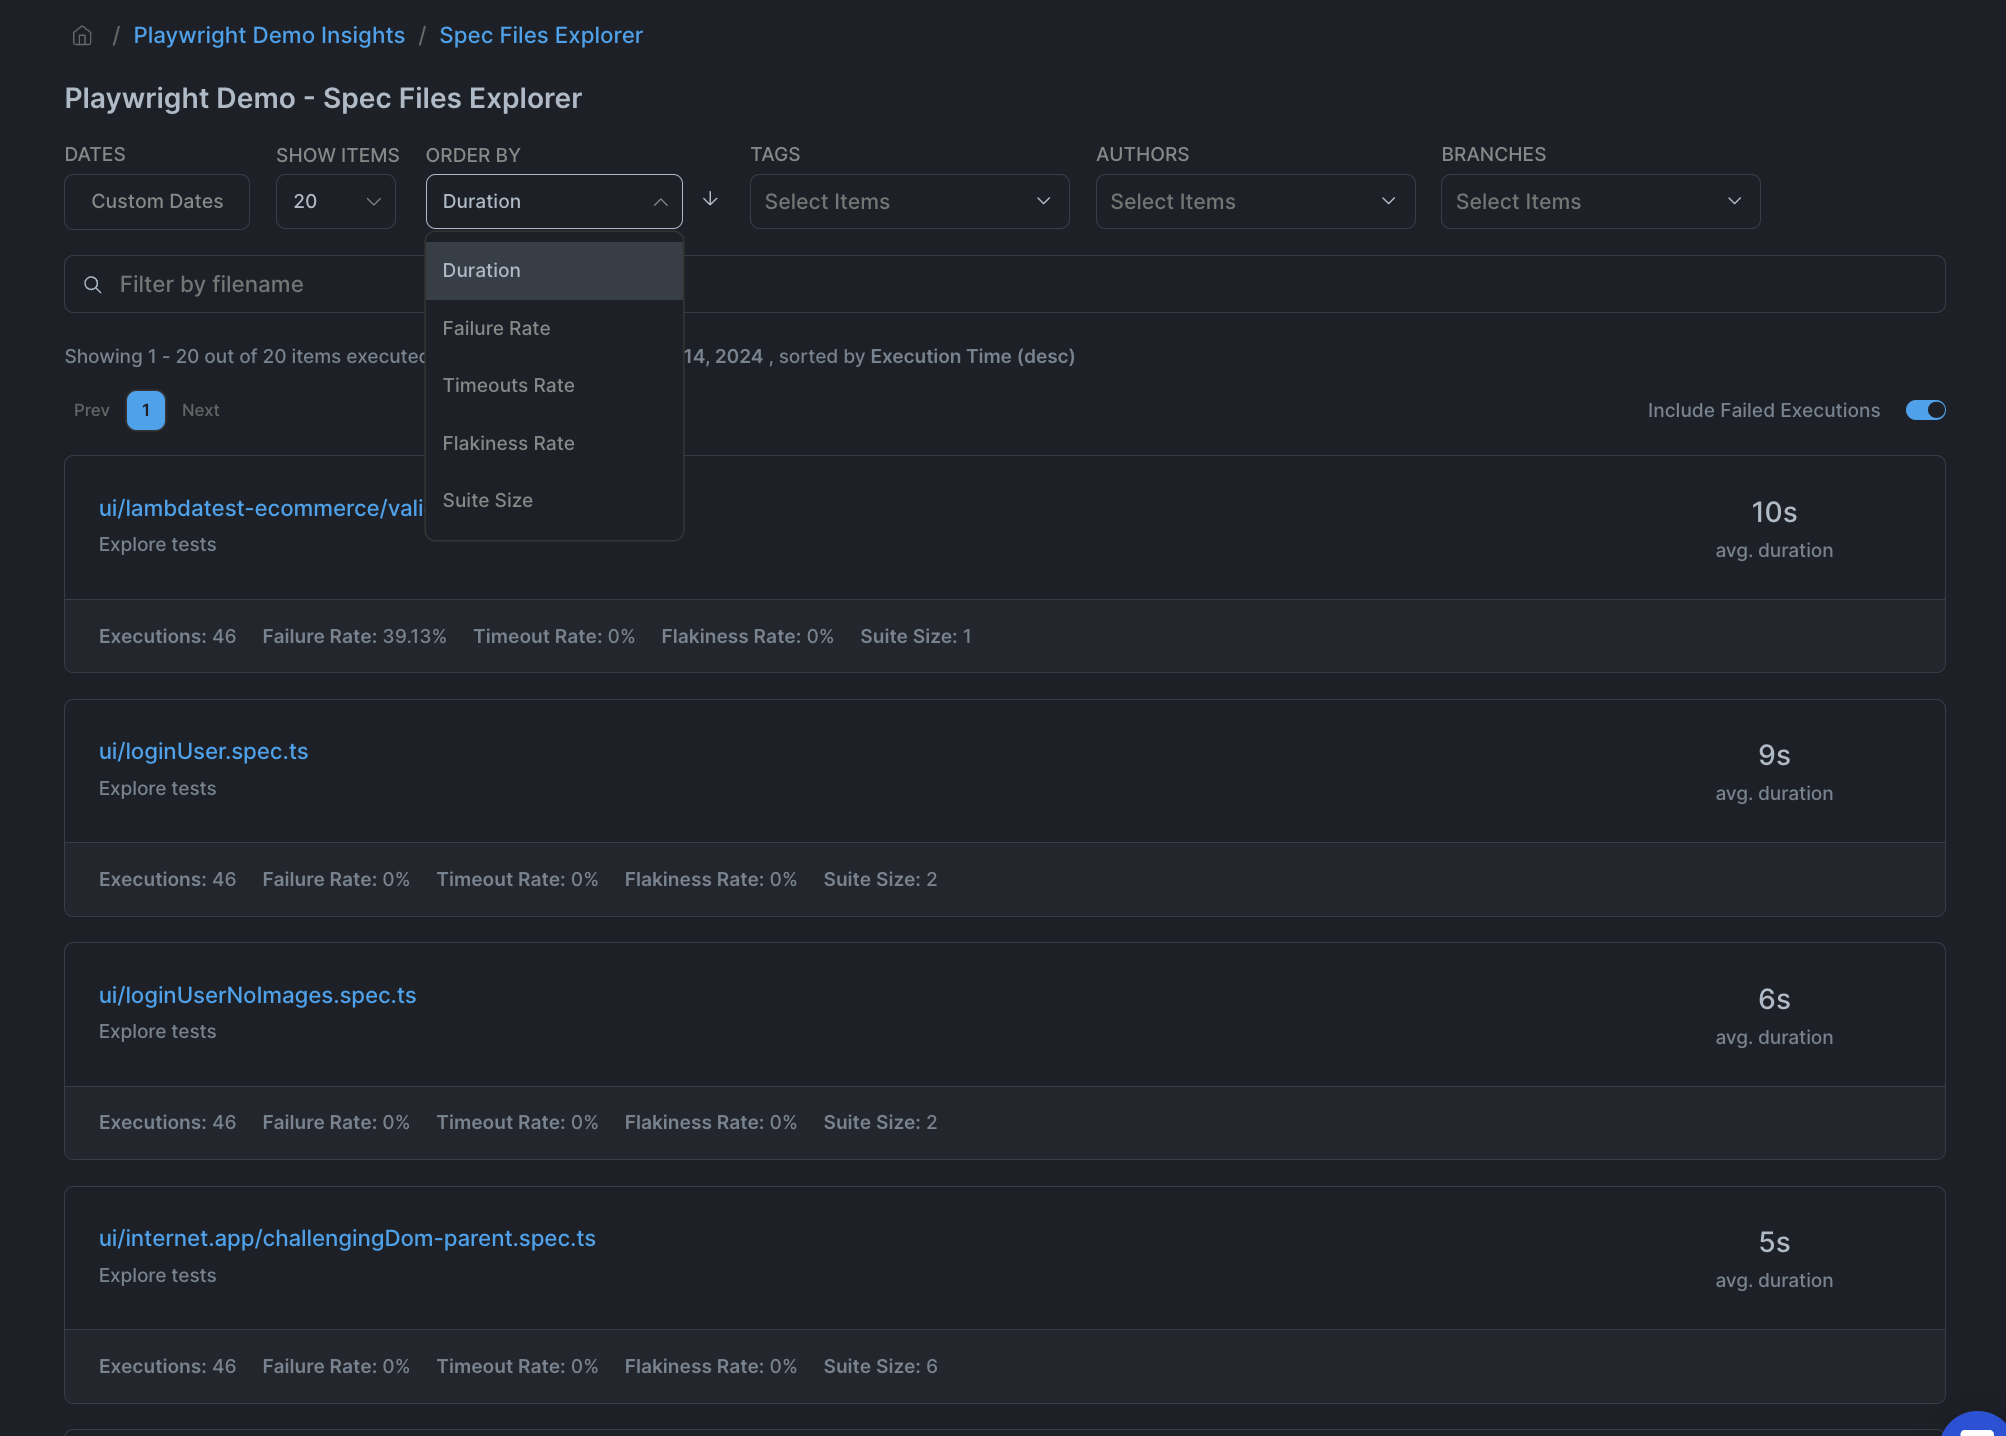
Insights - Spec Files Explorer
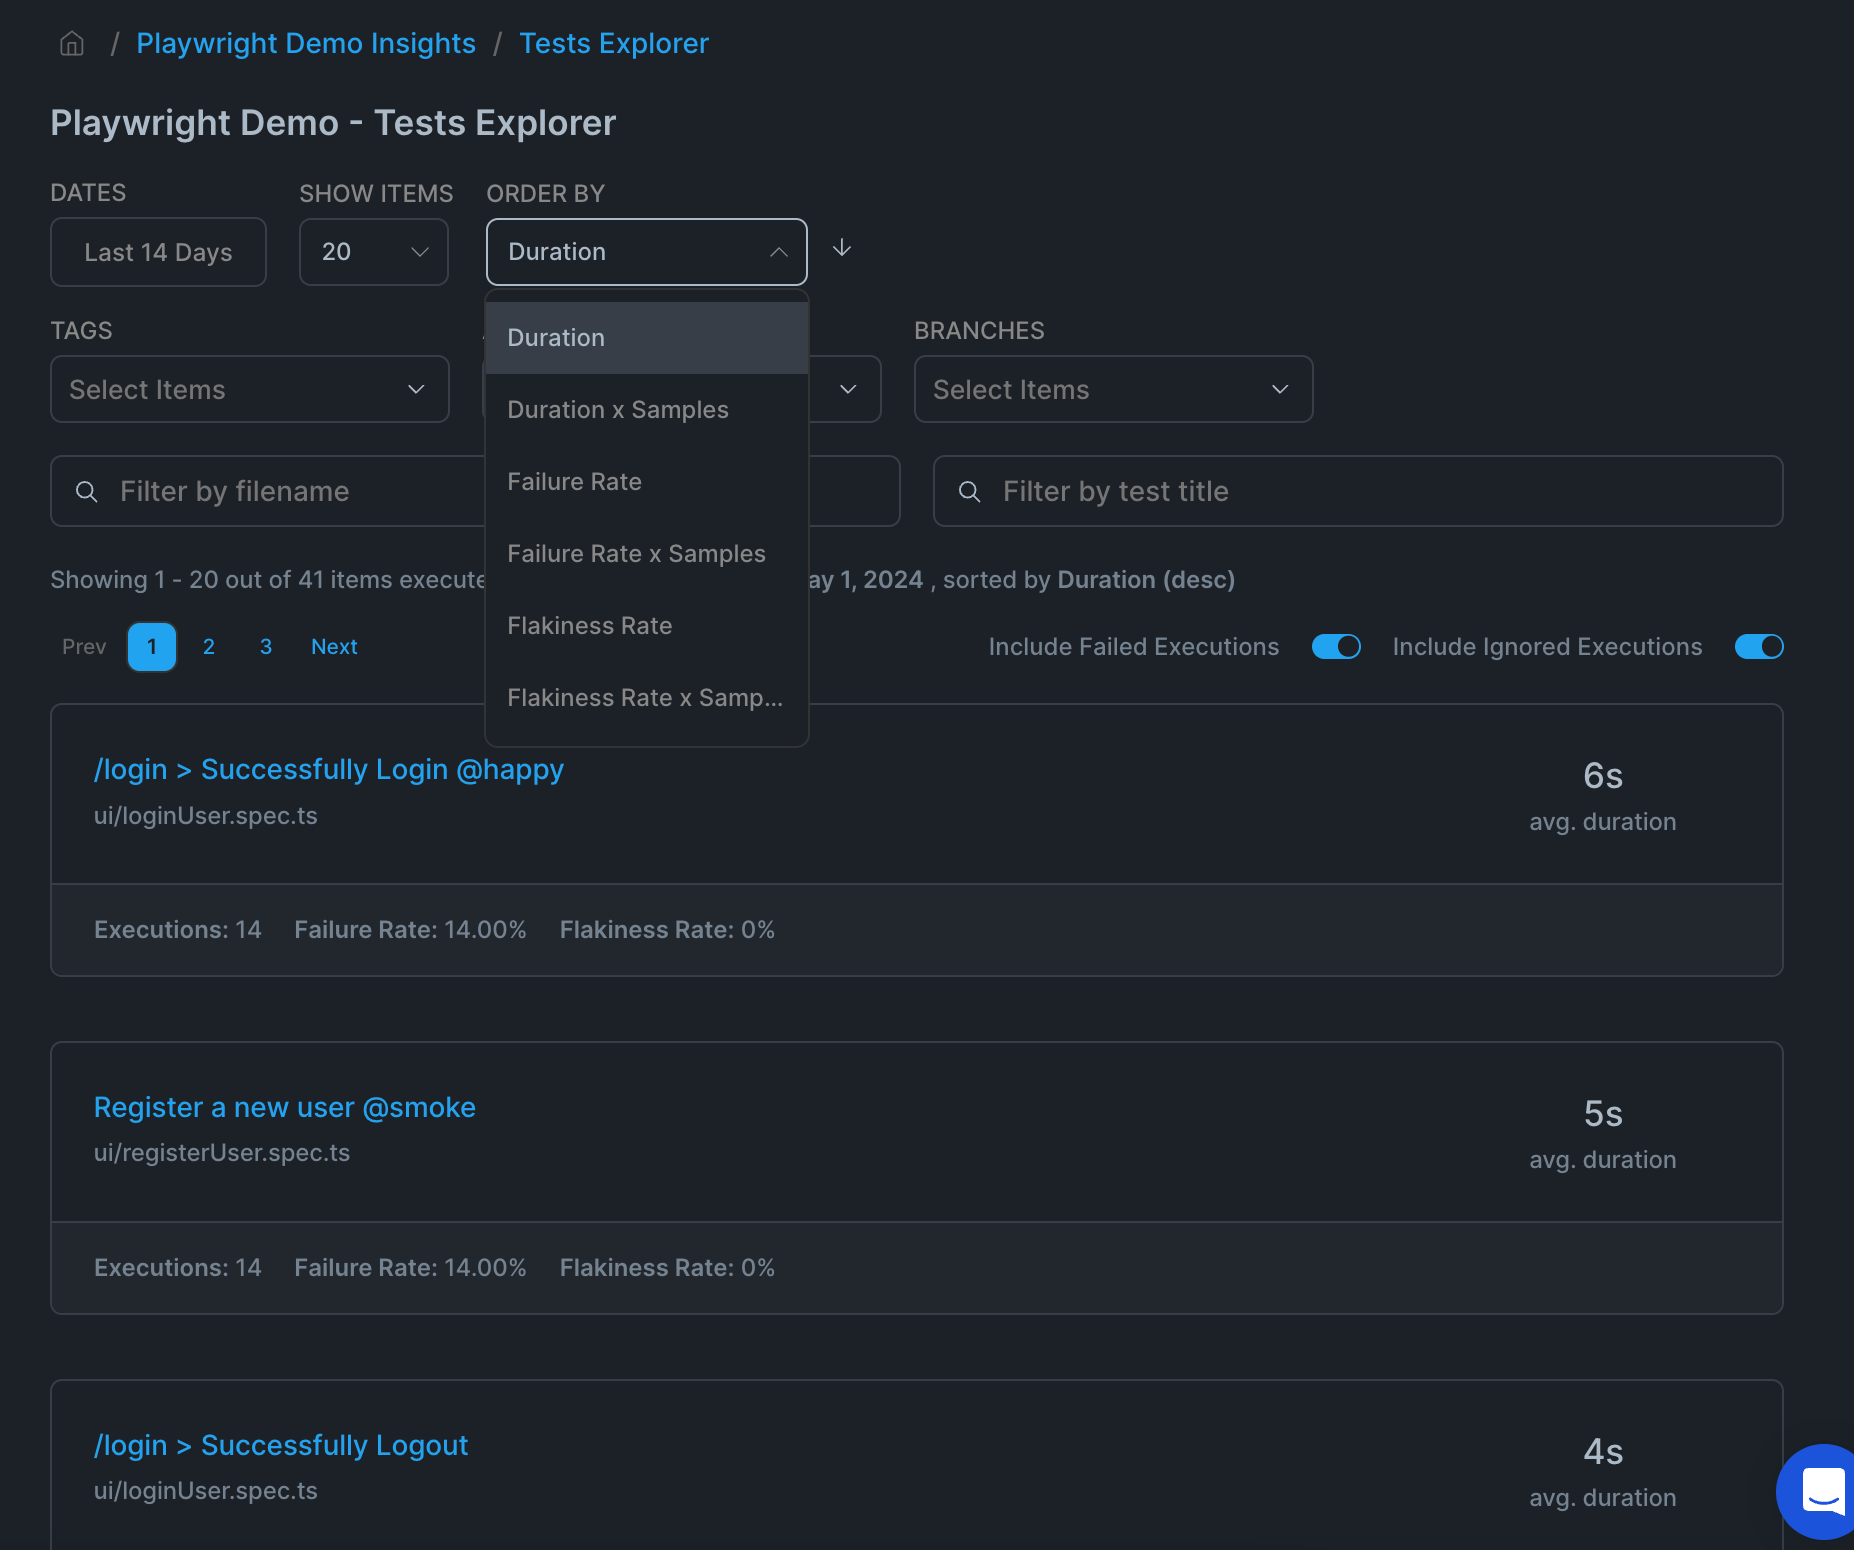
The spec file explorer groups tests by the spec file. with all the different order by options: Duration, Failure Rate, Flakiness Rate, and Suite size. Each of these views are helpful in their own ways depending on what questions you have about your test runs.
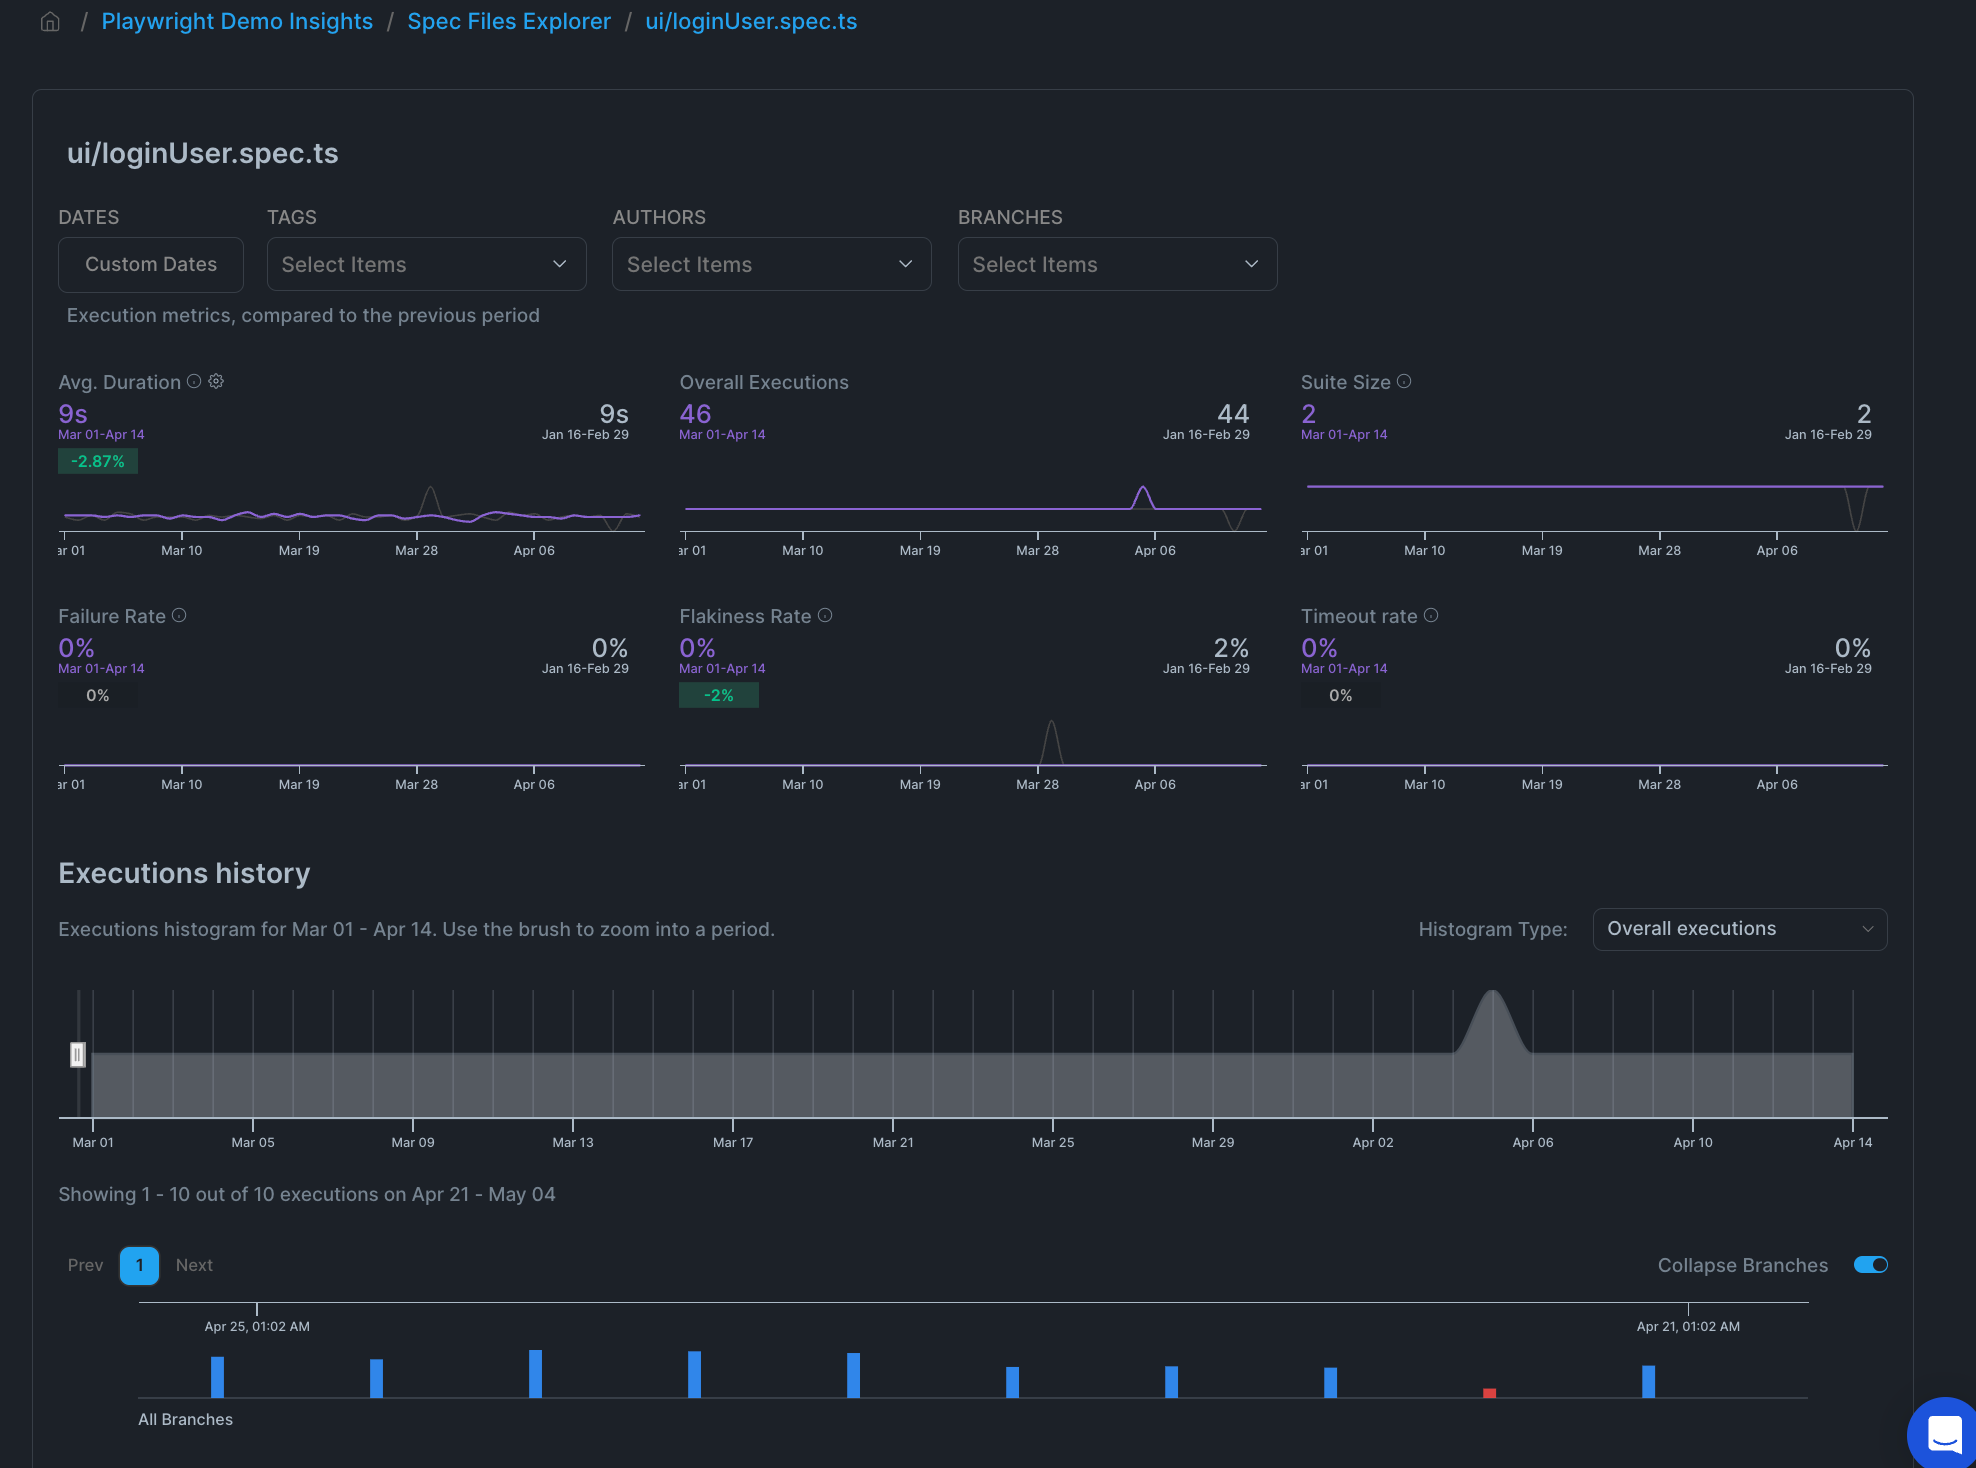
When you click on a spec file you get linked to the Spec Files Explorer > Spec Name View. This view allows you to inspect your data overtime by visualizing the data across 8 different views. Many of these views include a change icon indicating green positive or red negative see average duration time below (-2.87% decrease) which is great because we all want our tests to run faster!
Insights - Tests Explorer
The Test Explorer will show each test that has run in the dates selected in the list. There is also a handy search (filter by test tile) input box that makes it easy to find the exact test you are looking for quickly.
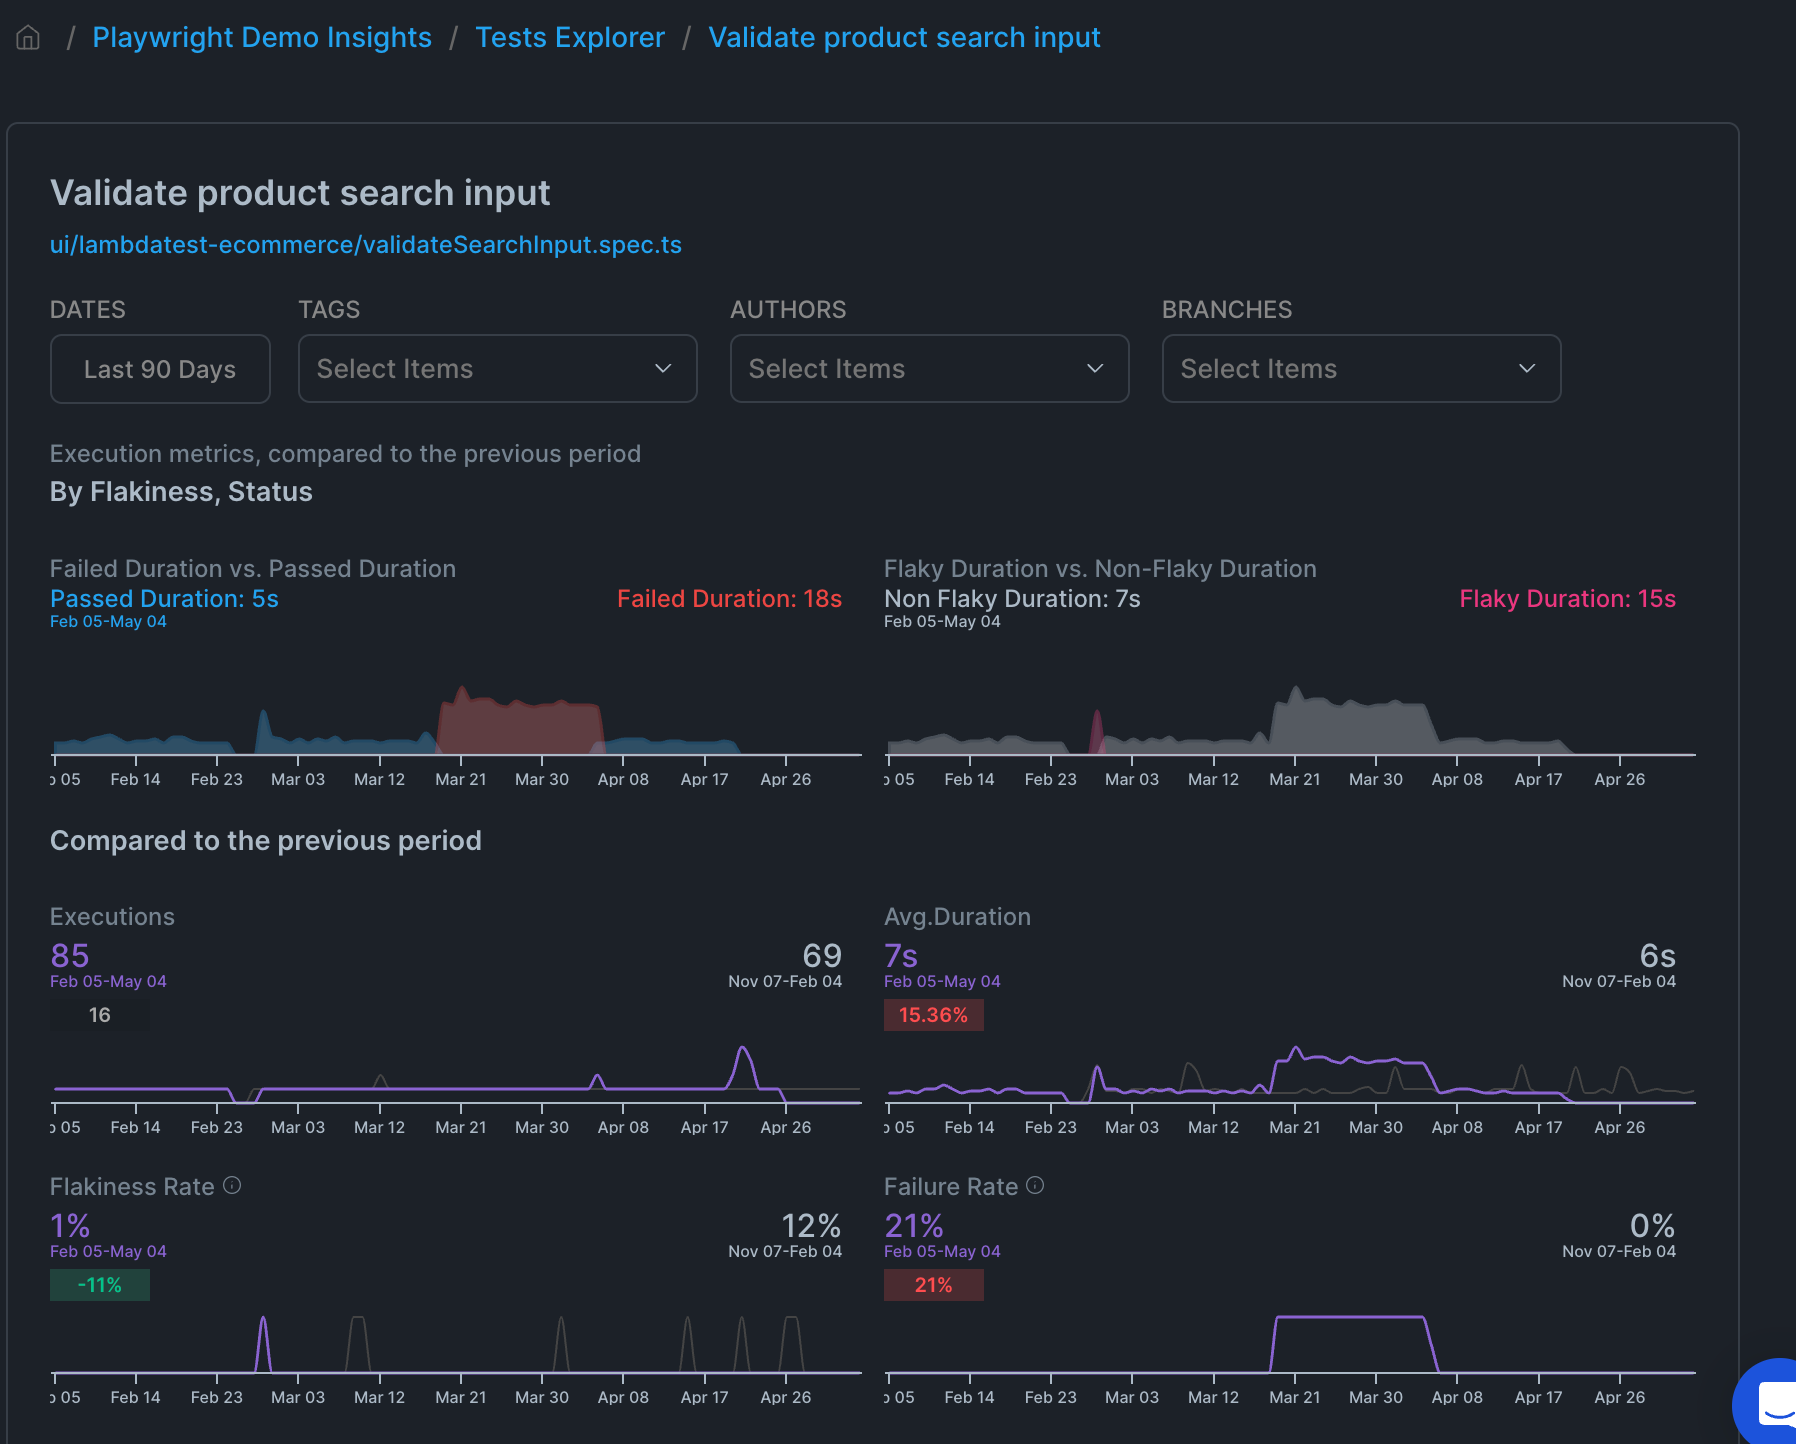
When you click on a spec file you get linked to the Test Explorer > Test Name View. This view allows you to inspect your data overtime by visualizing the data across 8 different views. This functionality matches the Spec Name view, but allows you to look at each individual test block rather than a whole spec file. Typically this is where I would be spending most of my time when investigating trends from a certain test.
One thing worth noting that if you do change the naming of a test, Currents Dashboard will treat this as a new test (technically it is) and the new test and the previous history of the old test will not be linked. I honestly think this is ok, but it's something to be aware of.
Insights - Errors Explorer
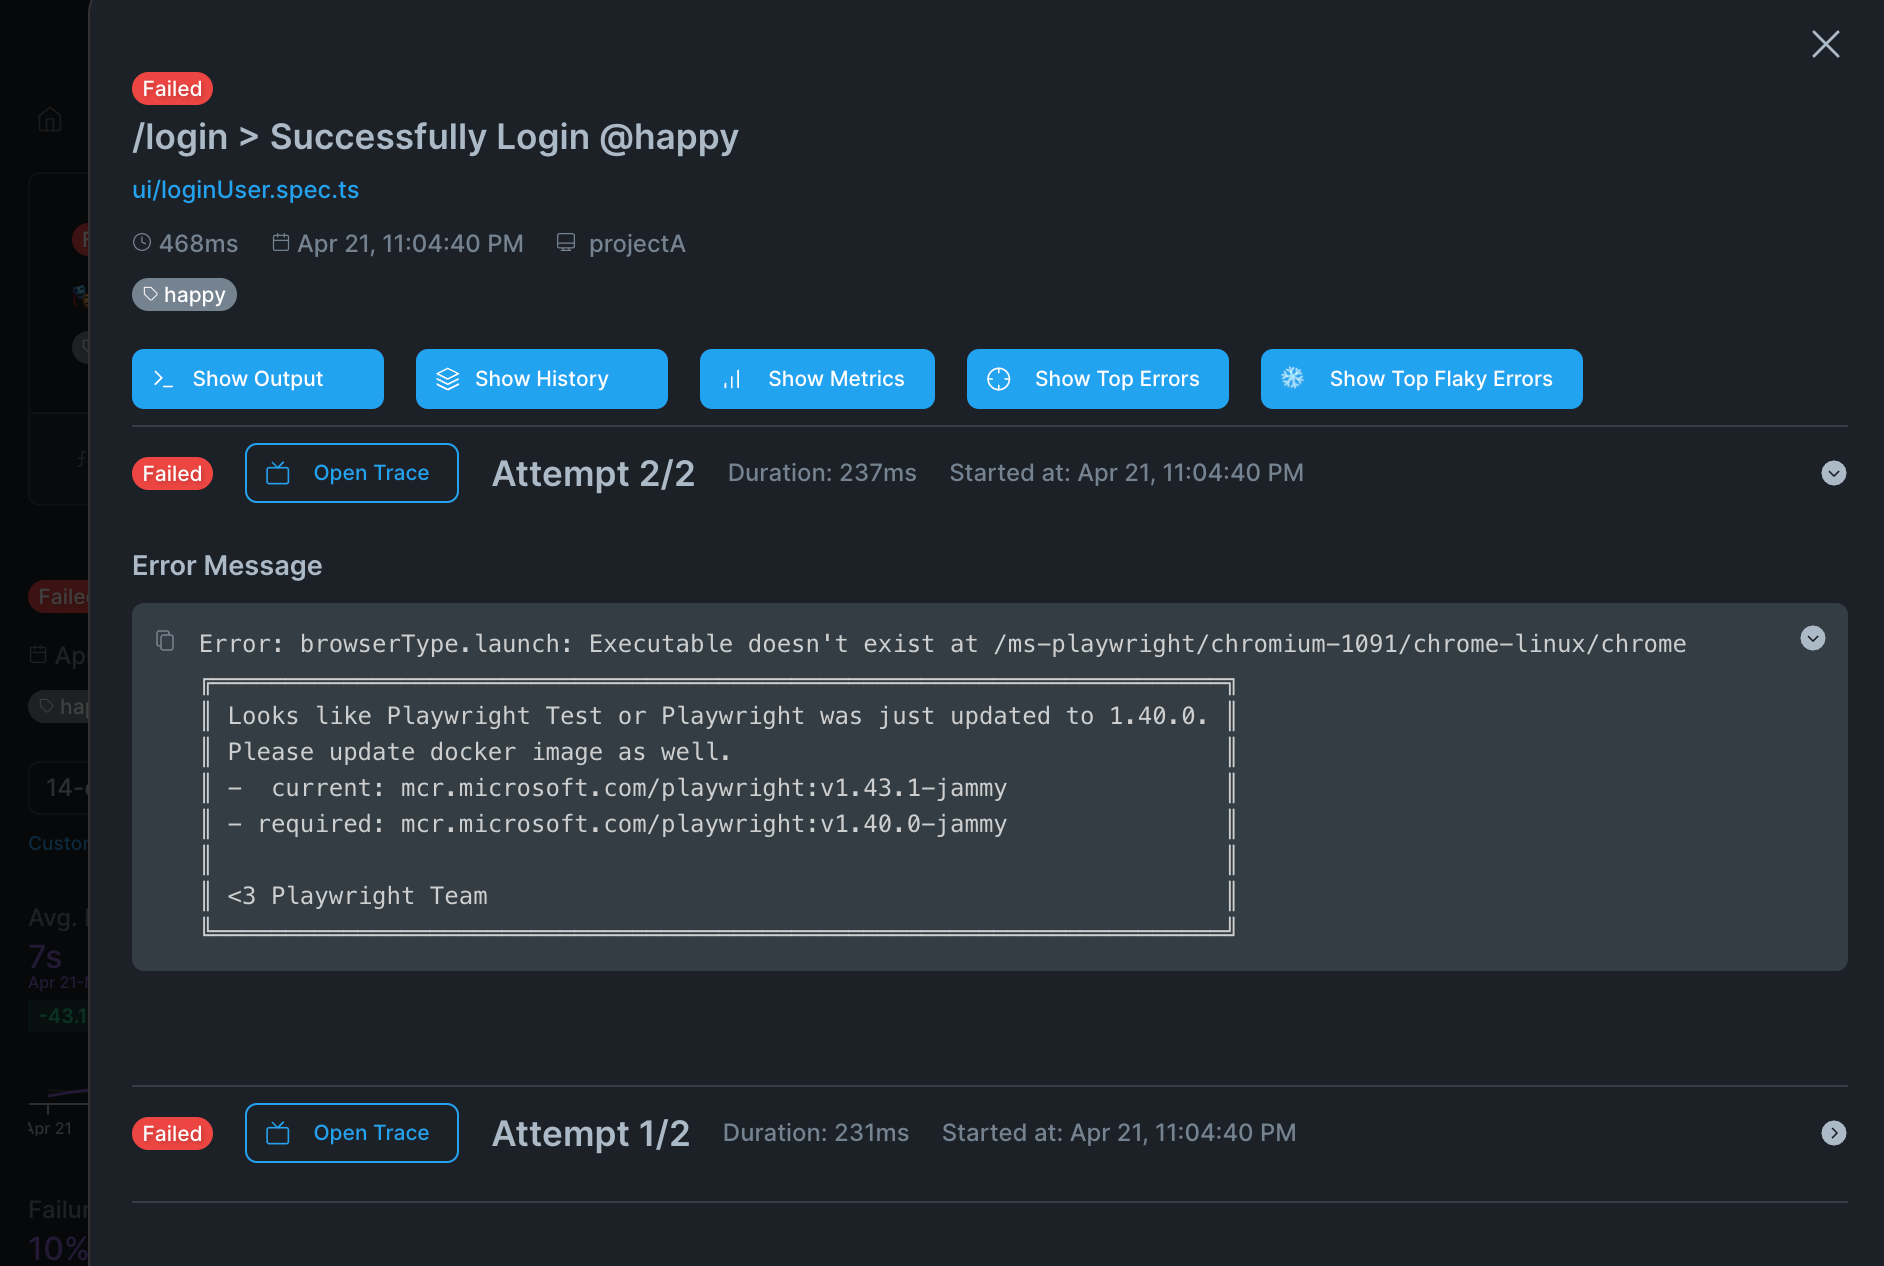
The final view is the Errors Explorer which includes a list of all the errors grouped by error name. This will be really helpful for you and your team to identify the most common errors in one place. In the image below you can see I had 23 errors for a browserType.launch error.
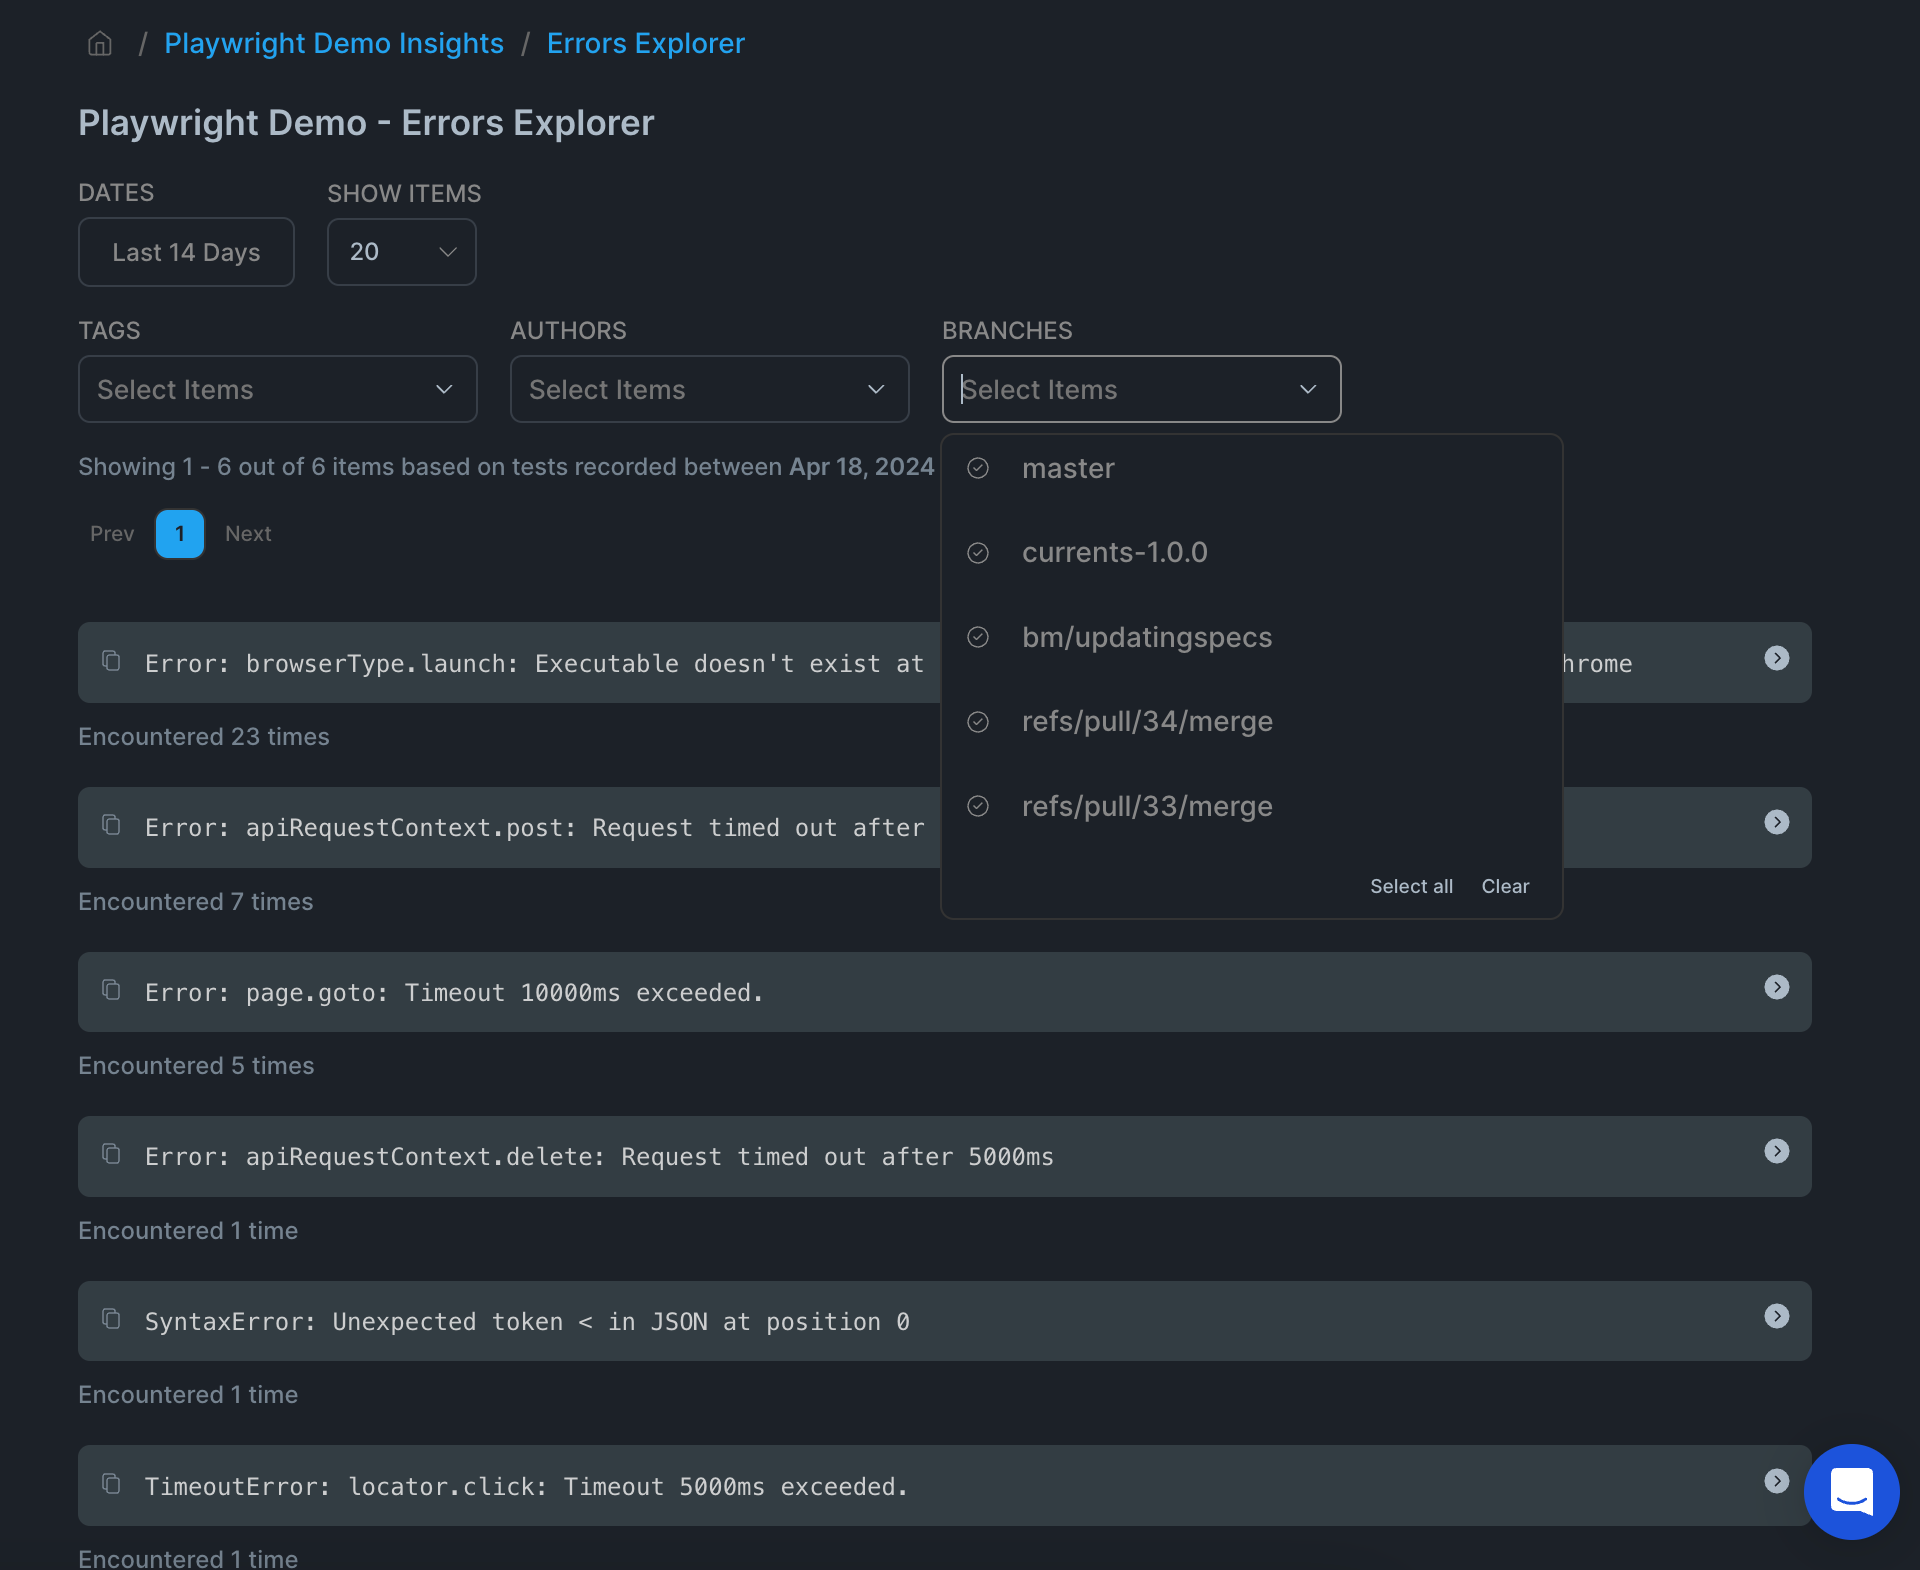
I was able to quickly dive into the error, and get the full error message from the test detail view, and found that I had updated my GitHub action to use the latest Playwright version 1.43.1 but I hadn't update my package.json it was still locked to 1.40.0.
Test Run View
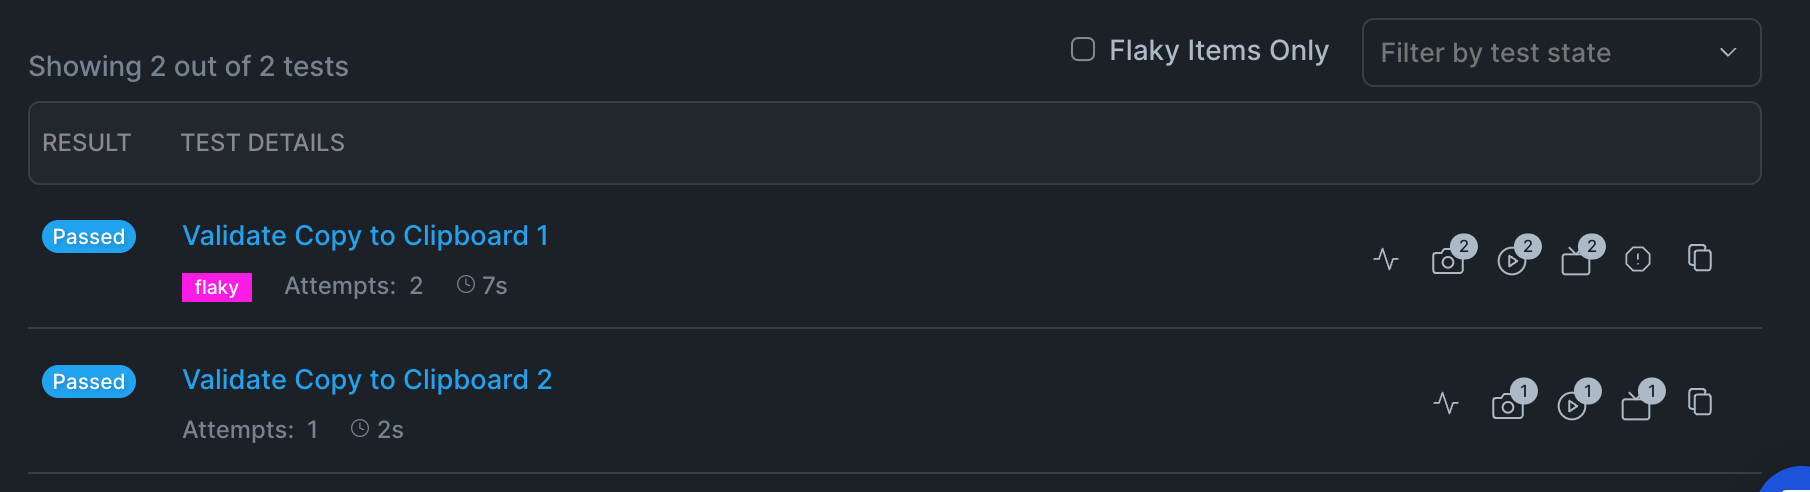
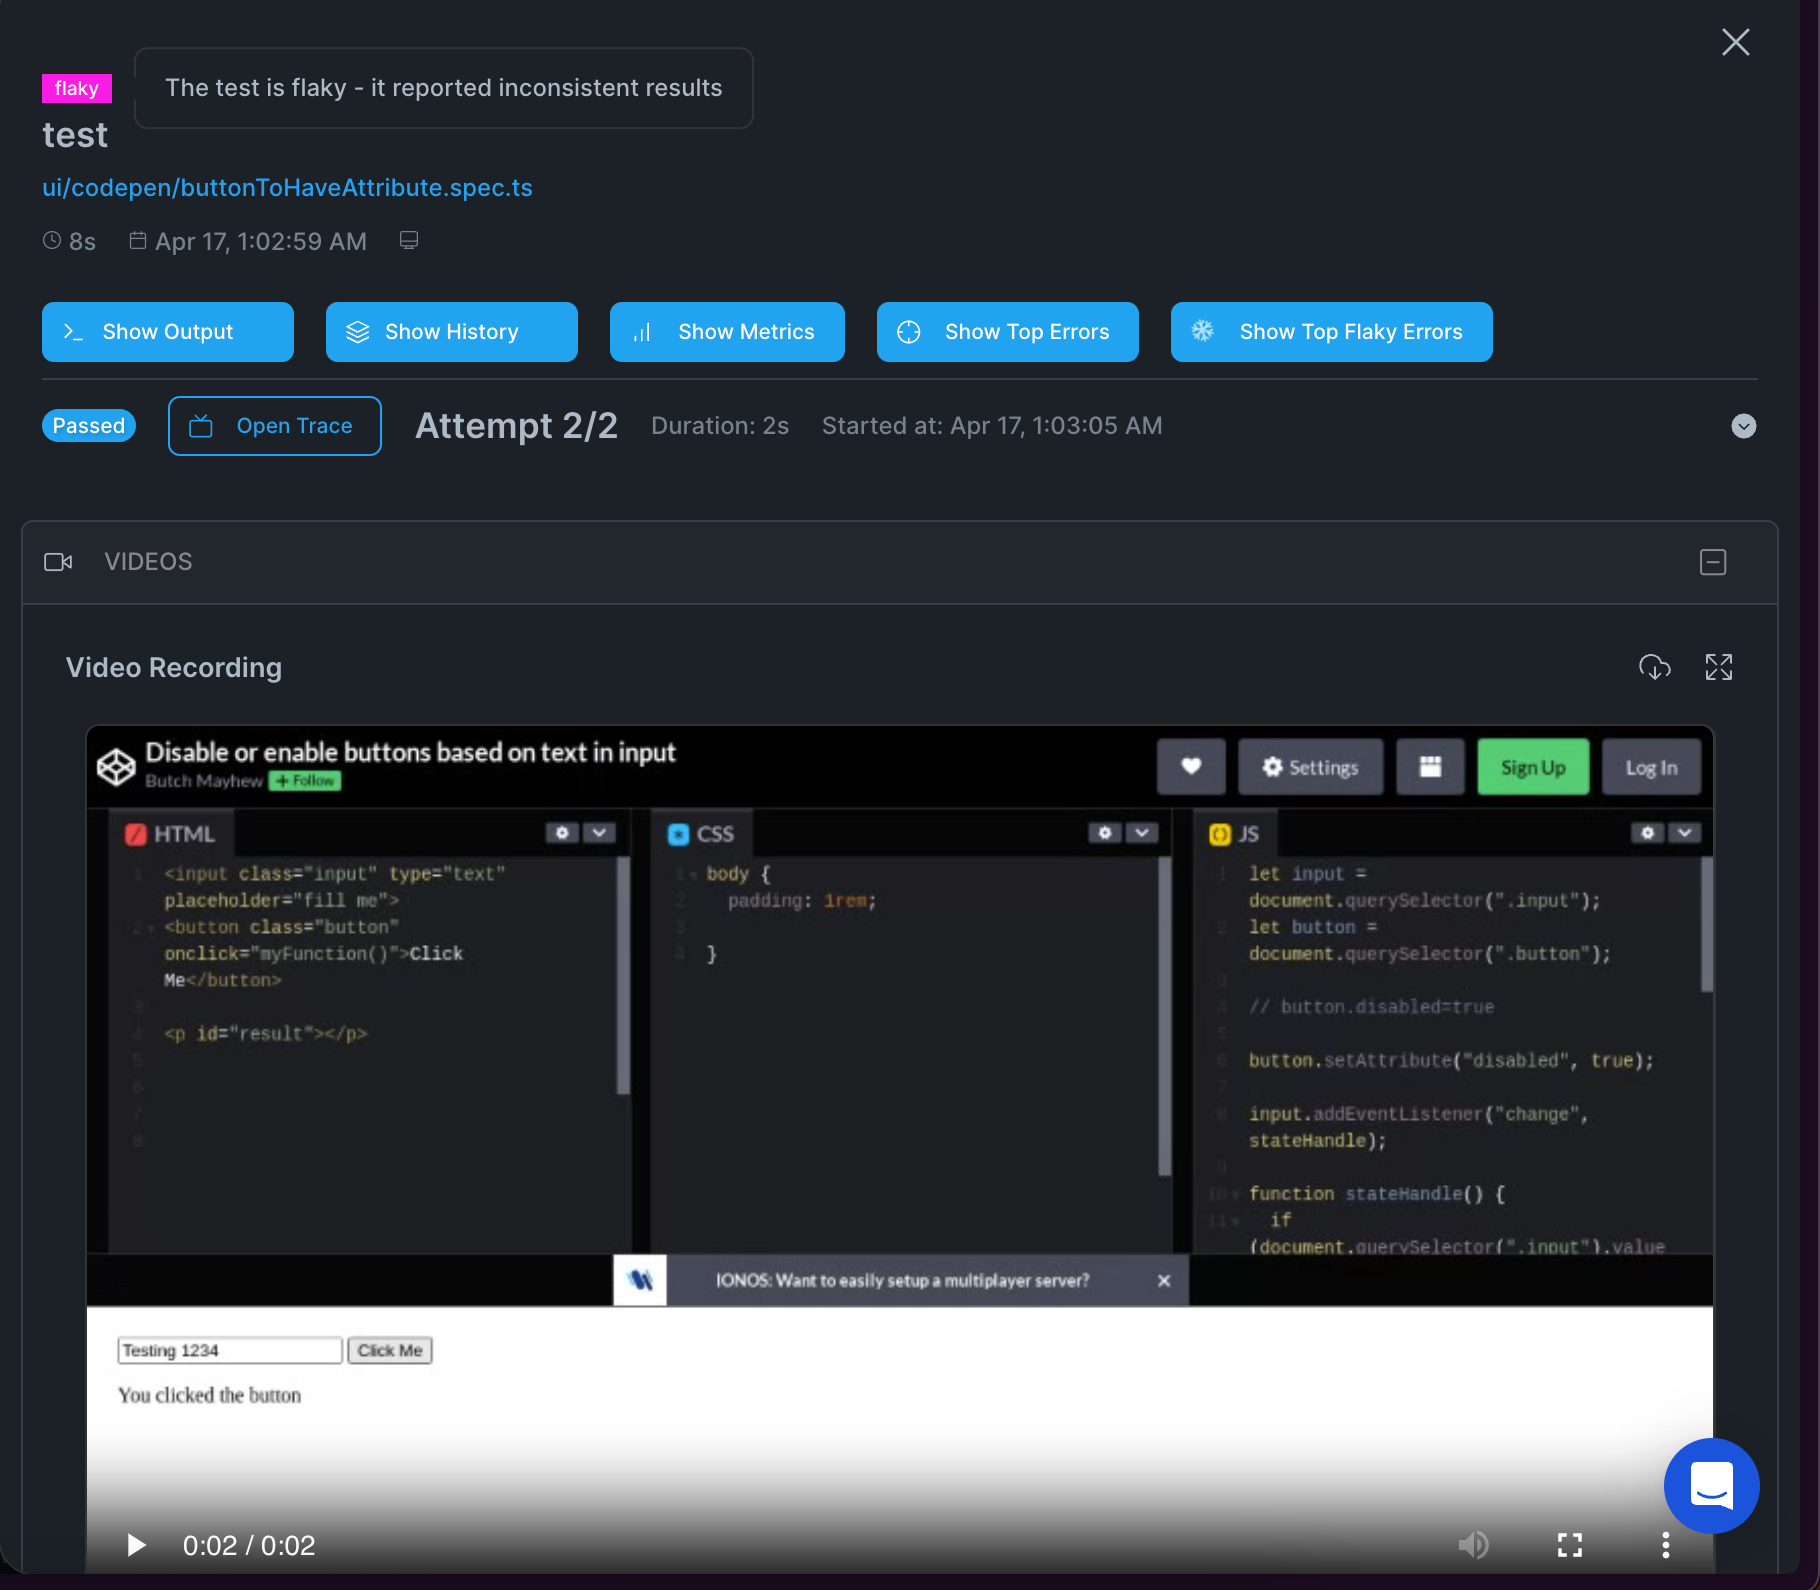
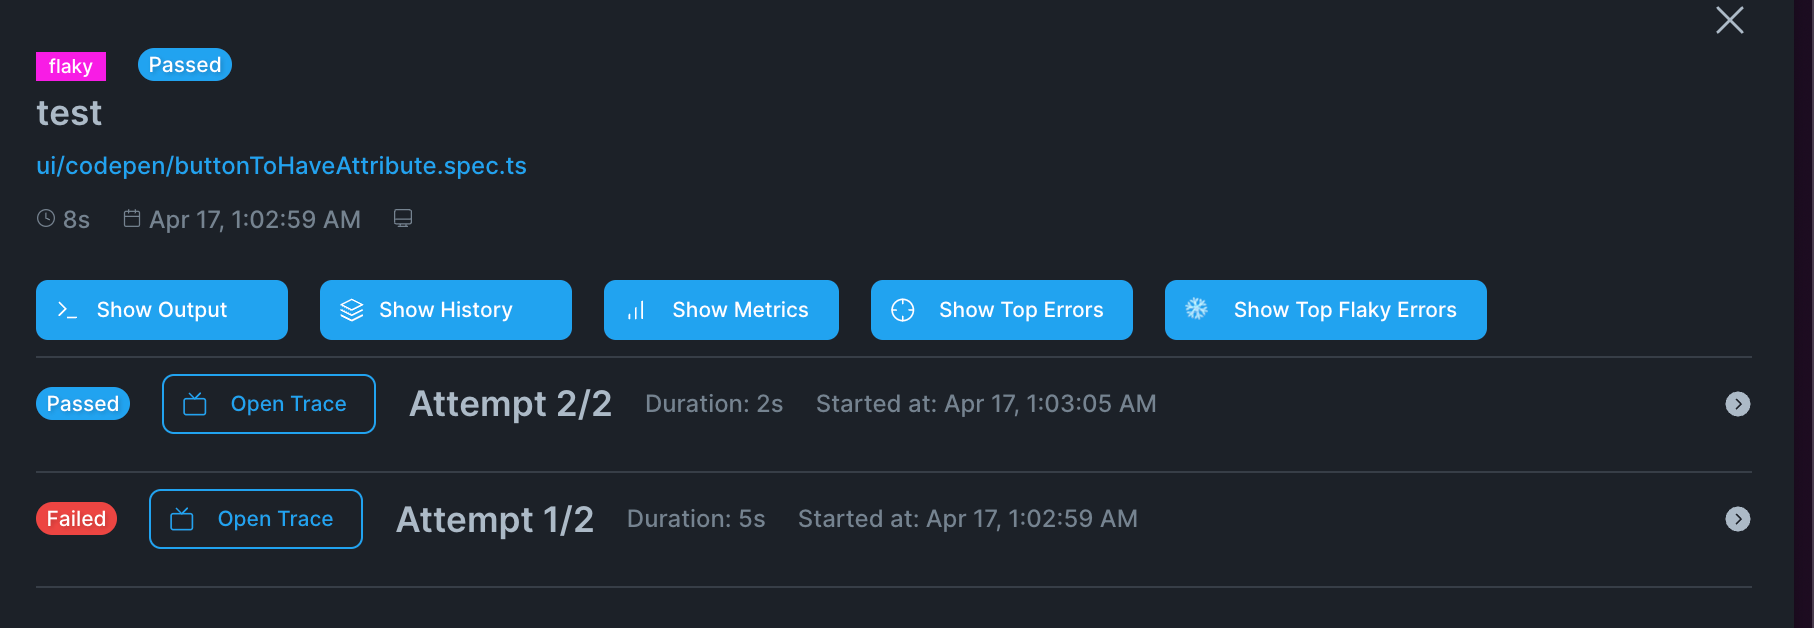
The final view which is one of the lowest level views in the Currents Dashboard is typically where you will end up when you want all the details of a specific test, that ran at a specific time. This view includes all the information you get from the default Playwright Reporter along with some additional goodies.
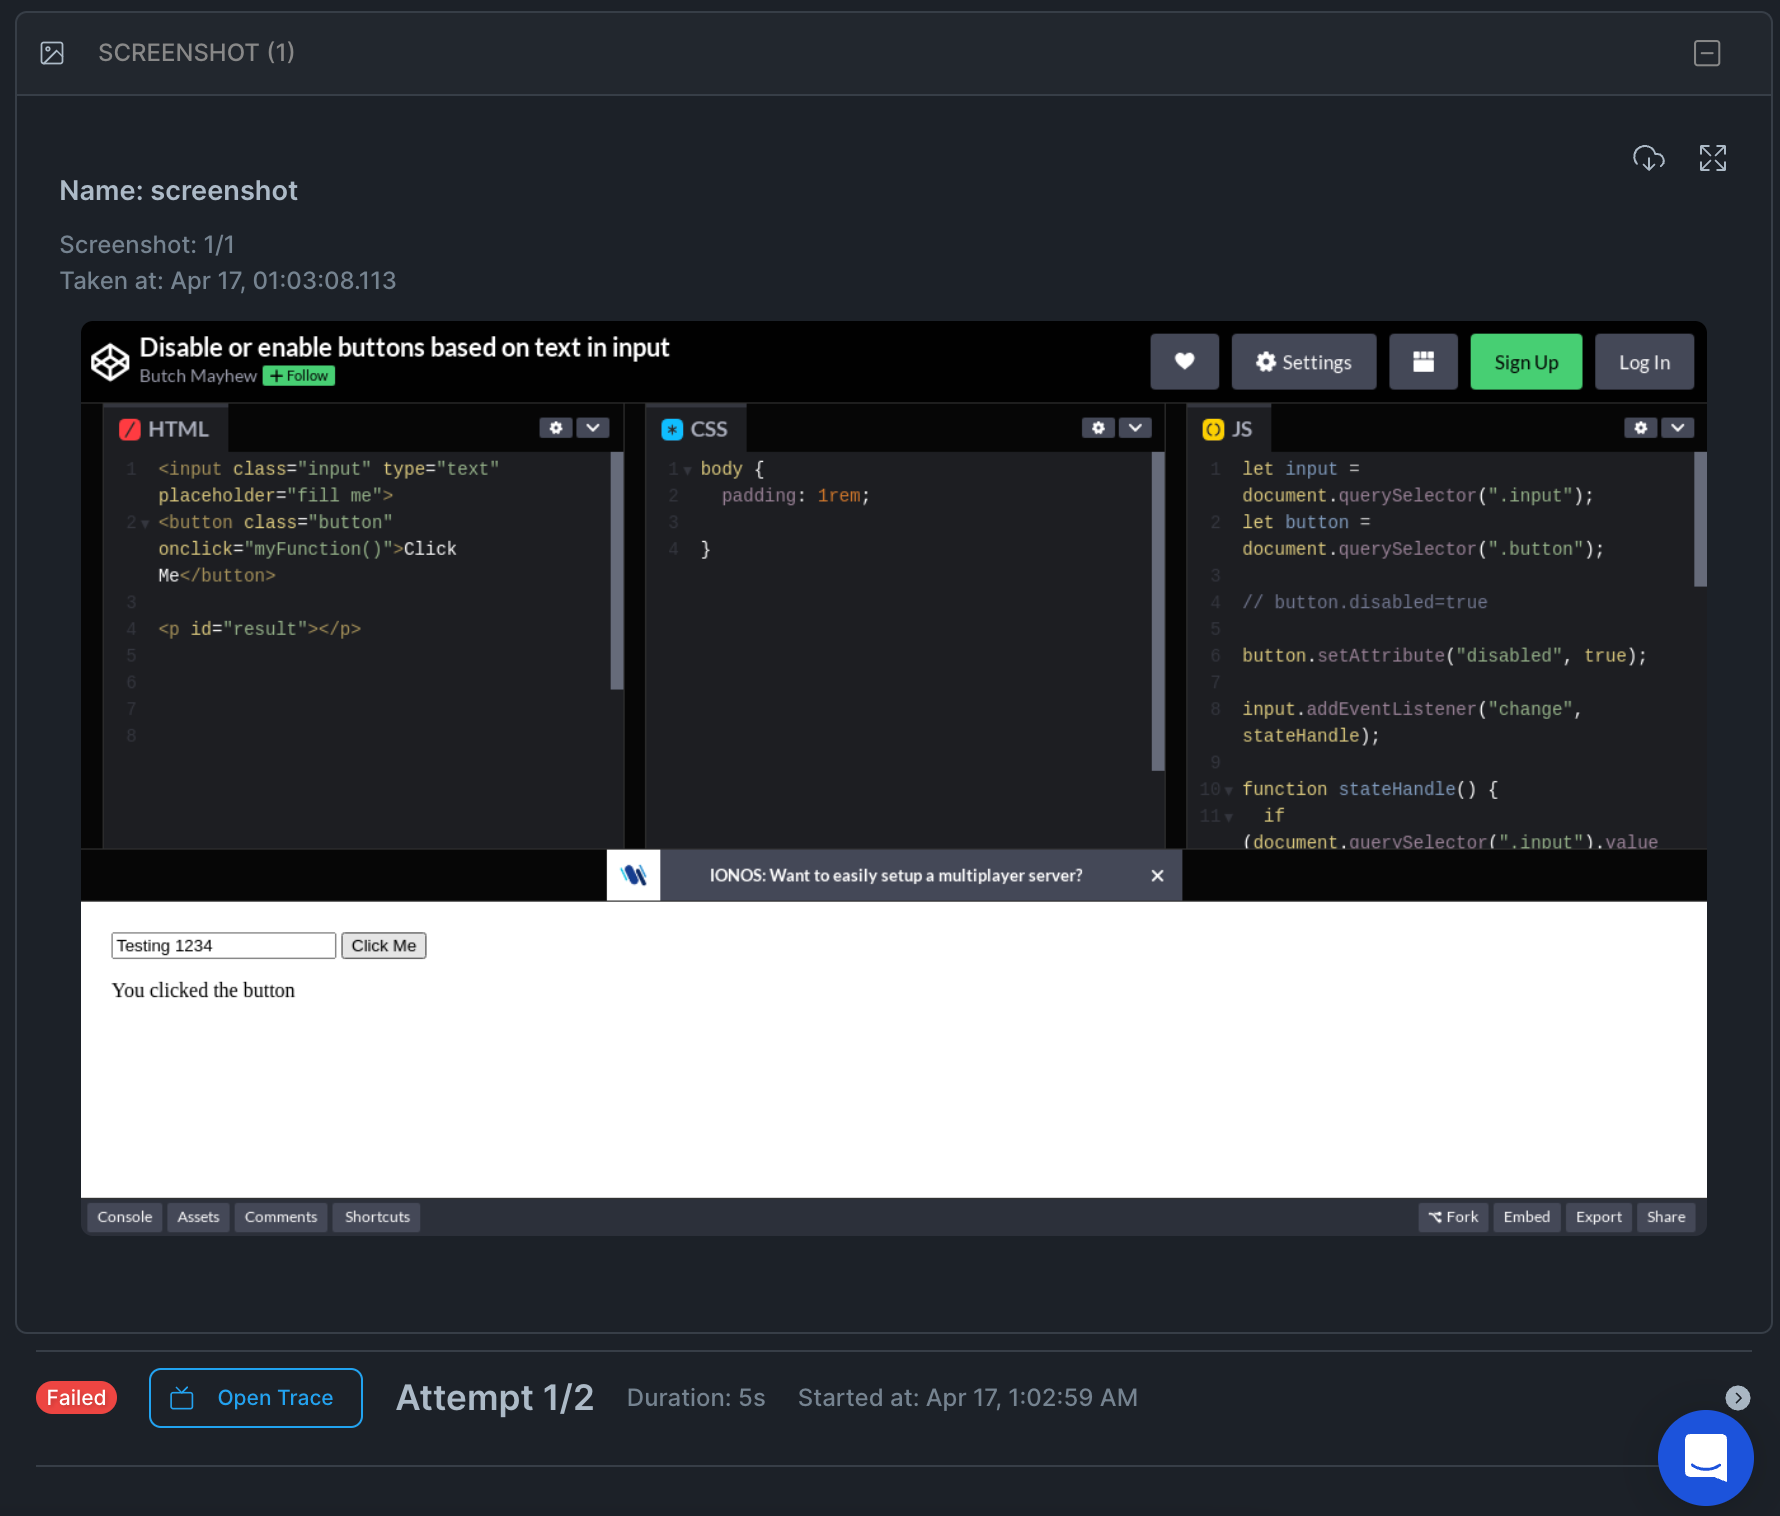
When you first land onto the page you can notice you have a lot of options here (see the following 3 images below). In my example below I have a flaky test tag because the first attempt failed while the second attempt passed. You have access to a lot of the other views from this test level that can be accessed from the blue buttons in the screenshot below, but the most important items to me on this view is the recorded video, the screenshot(s), and the ability to view the Playwright Trace. If you aren't familar with the Playwright Trace, it gives you access to the DOM, Console, and Network Requests that were made throughout the test. This is my go to tool when trying to identify the root cause of any issues.
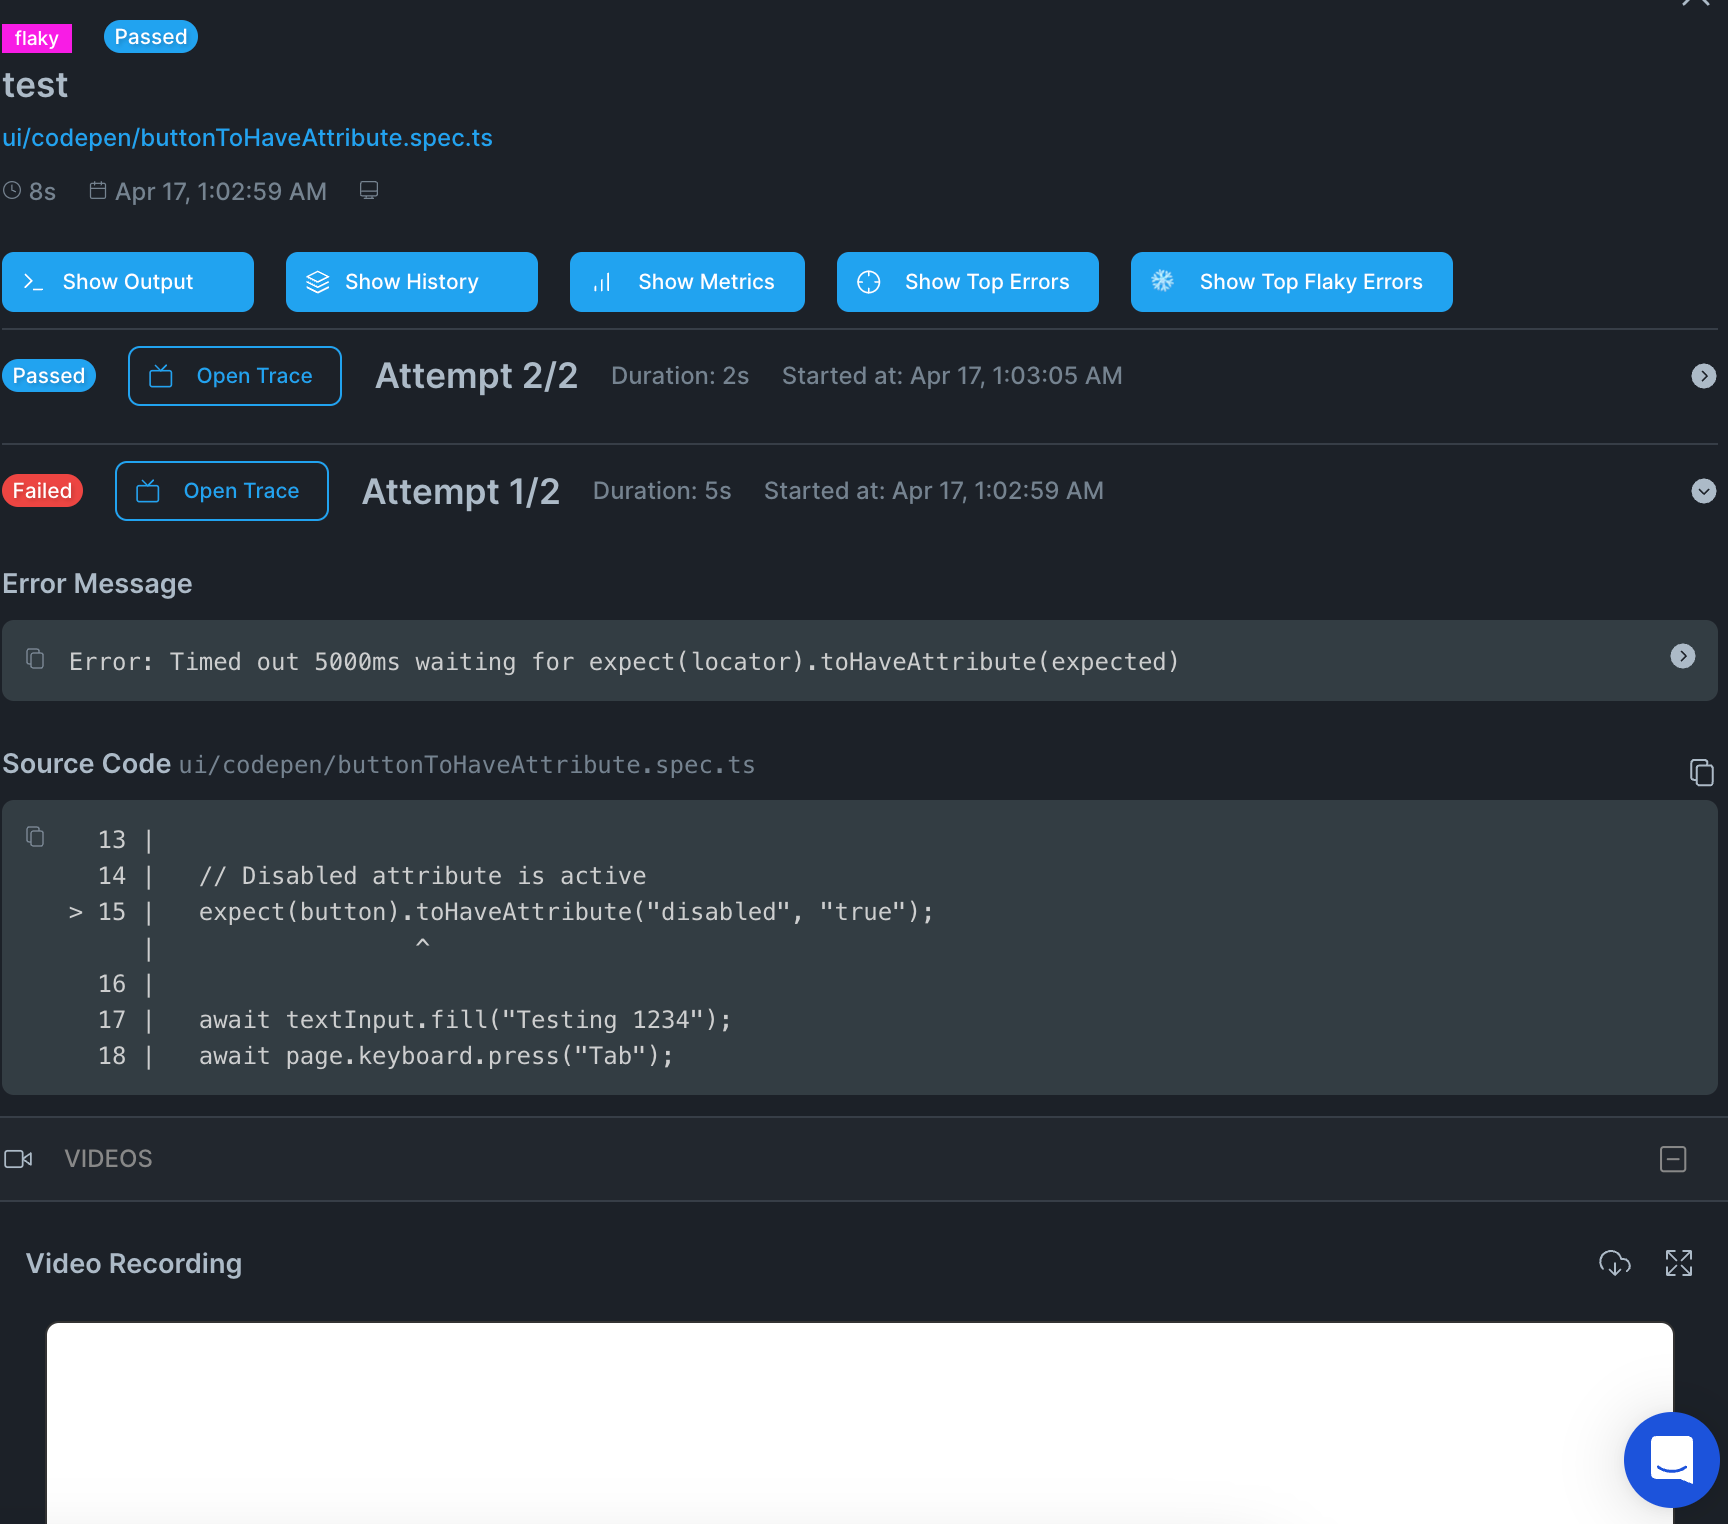
Another nice feature for test that have multiple runs is the attempts are collapsable.
Things I Did Not Cover
I experimented with the below items but felt that each teams needs are unique in the integrations section. Check out the docs for each below!
- Currents API Access
- Automated Reports Email
- GitHub Integration
- GitLab integration
- Slack Integration
- Microsoft Teams Integration
Things I Like About Currents Dashboard
- The ability to quickly view the status of all Test Automation Projects in one place.
- I found it helpful to see trend lines and averages when exploring a range of test runs.
- I'm a big fan of being able to download just about any view of data to CSV.
- Being able to track/trend flaky tests overtime is a game changer!
- It's just plain easy to implement into your existing projects using Playwright TS/JS & the built in Test Runner.
- Integrating with Github was easy, and makes required test runs within a CI pipeline easy to manage.
- No credit card needed to get started. Take Advantage of the Free 14-day trial!!!! (It's Free, no commitment, no credit card, just give it a go!)
- Clear and transparent pricing.
- Quick communication from bug reports with quick fixes.
- The Customer Success Manager is on top of things, proactively asking how they could assist me on my journey.
- The newly released orchestration functionality will help give quicker feedback!
- Frequent Updates to Currents Playwright Dashboard - See Changelog
- Dark Mode!
- The flexibility to utilize Playwright's CLI flags when running the
npx pwccommand!
Things I Don't Like About Currents Dashboard
- I would love the ability to lock in a date time range that would persist across different graphs and pages. Currently if you want to sort by January 1 - March 31, I have to go in and select these custom dates through each of the different Insights dashboards. I did make a feature request with the Currents team for this as it would make exploring through reports over a custom dates less painful.
- There is a bit of a learning curve as you have probably felt while reviewing the different screenshots from the system. There is so much data available and lots of different ways to slice and dice it.
- The limitations on the Orchestration functionality may be difficult to adopt without refactoring code if using any of the Playwright global setup functionality.
Conclusion
This is the Playwright Reporting Dashboard I had no idea I needed.
You will need to come up with your own strategies on how best to send data to the Currents Dashboard. I did find that I tended to only want to send data to the dashboard when I was running a full run against a specific project. I decided to skip sending data to Currents Playwright Dashboard when, I am only running a subset of tests in CI, when running tests on my local machine.
And Finally...

Thanks for reading! If you found this helpful, reach out and let me know on LinkedIn or consider buying me a cup of coffee. If you want more content delivered to you in your inbox subscribe below, and be sure to leave a ❤️ to show some love.